![Featured image: [ENCODE GRAMMAR] Quickstart: Accessing and using the ENCODE GRAMMAR collection](/blogs/2026-013/MYC_fig1.png)
This is the second post in a series on ENCODE GRAMMAR. The series will cover:
- ENCODE GRAMMAR: The ENCODE deep learning model resource for decoding the DNA sequence logic of genomic regulatory elements
- Accessing and using the ENCODE GRAMMAR collection: A quickstart guide (this post)
- Interpreting regulatory DNA with deep learning models
- The transcription factor binding GRAMMAR resource
- The chromatin accessibility GRAMMAR resource
- Predicting the effects of noncoding genetic variants
- MotifCompendium - a unified lexicon of regulatory sequence motifs
- Contrasting regulatory sequence codes across assays and cell types
- Building a production-scale model atlas in an academic setting
Quick-start guide (5 min)
ENCODE GRAMMAR transforms individual ENCODE experiments into experiment-specific BPNet-family model sets together with predicted regulatory profiles, sequence-contribution maps, predictive motifs, motif instances, and variant-effect predictions. Readers who are new to the resource may wish to begin with the ENCODE GRAMMAR overview, which explains the biological motivation, model families, interpretation workflow, and complete collection of released products.
Below, we explain how to navigate an ENCODE GRAMMAR model-set annotation page and load several commonly used model outputs into the WashU Epigenome Browser. Visualizing these tracks is a useful first step before designing larger-scale quantitative analyses.
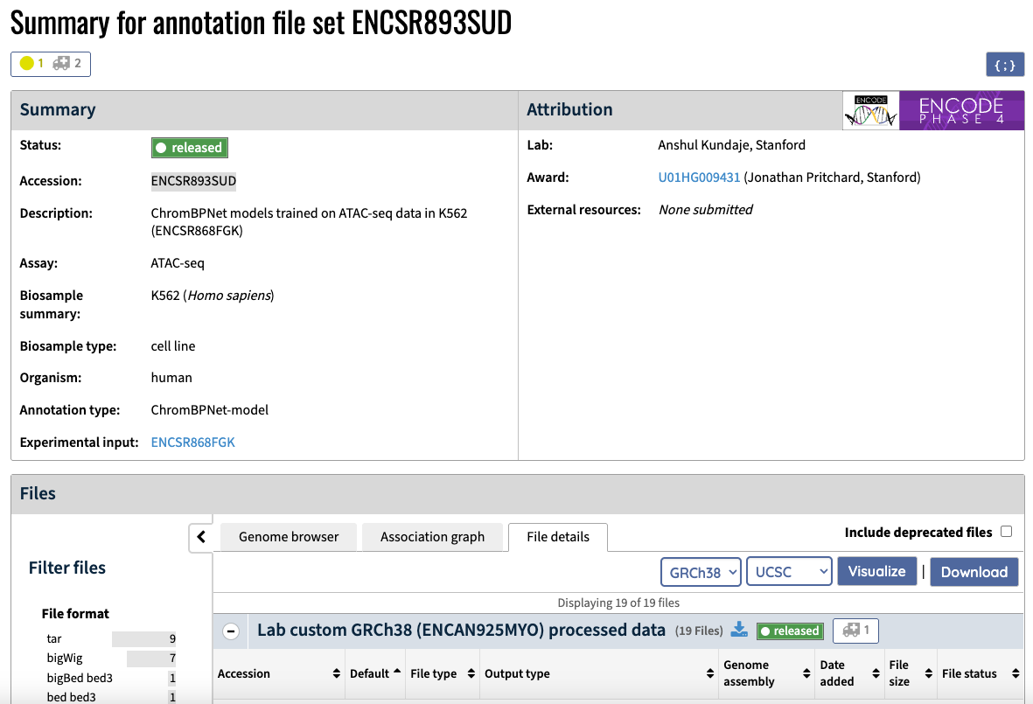
We use the example of a ChromBPNet model set generated from an ATAC-seq experiment in K562 cells (ENCSR893SUD).
Step 1: Find the model-set annotation page
Open the ChromBPNet model-set annotation for K562 ATAC-seq: https://www.encodeproject.org/annotations/ENCSR893SUD/.
Model-set annotations associated with an experiment can also be found from the corresponding experiment summary page.
A searchable list of all ENCODE annotations is available at https://www.encodeproject.org/annotations/.
Step 2: Find the files of interest
Scroll to the middle of the annotation page and select the File details tab to browse the available files.
For an initial exploration of a ChromBPNet model set, we recommend viewing three complementary tracks:
- the normalized observed signal profile, representing the experimentally measured chromatin-accessibility profile;
- the normalized predicted signal profile, representing the regulatory profile predicted by ChromBPNet from DNA sequence; and
- the counts sequence-contribution scores, estimating how much each DNA base contributes to the model’s prediction of total accessibility.
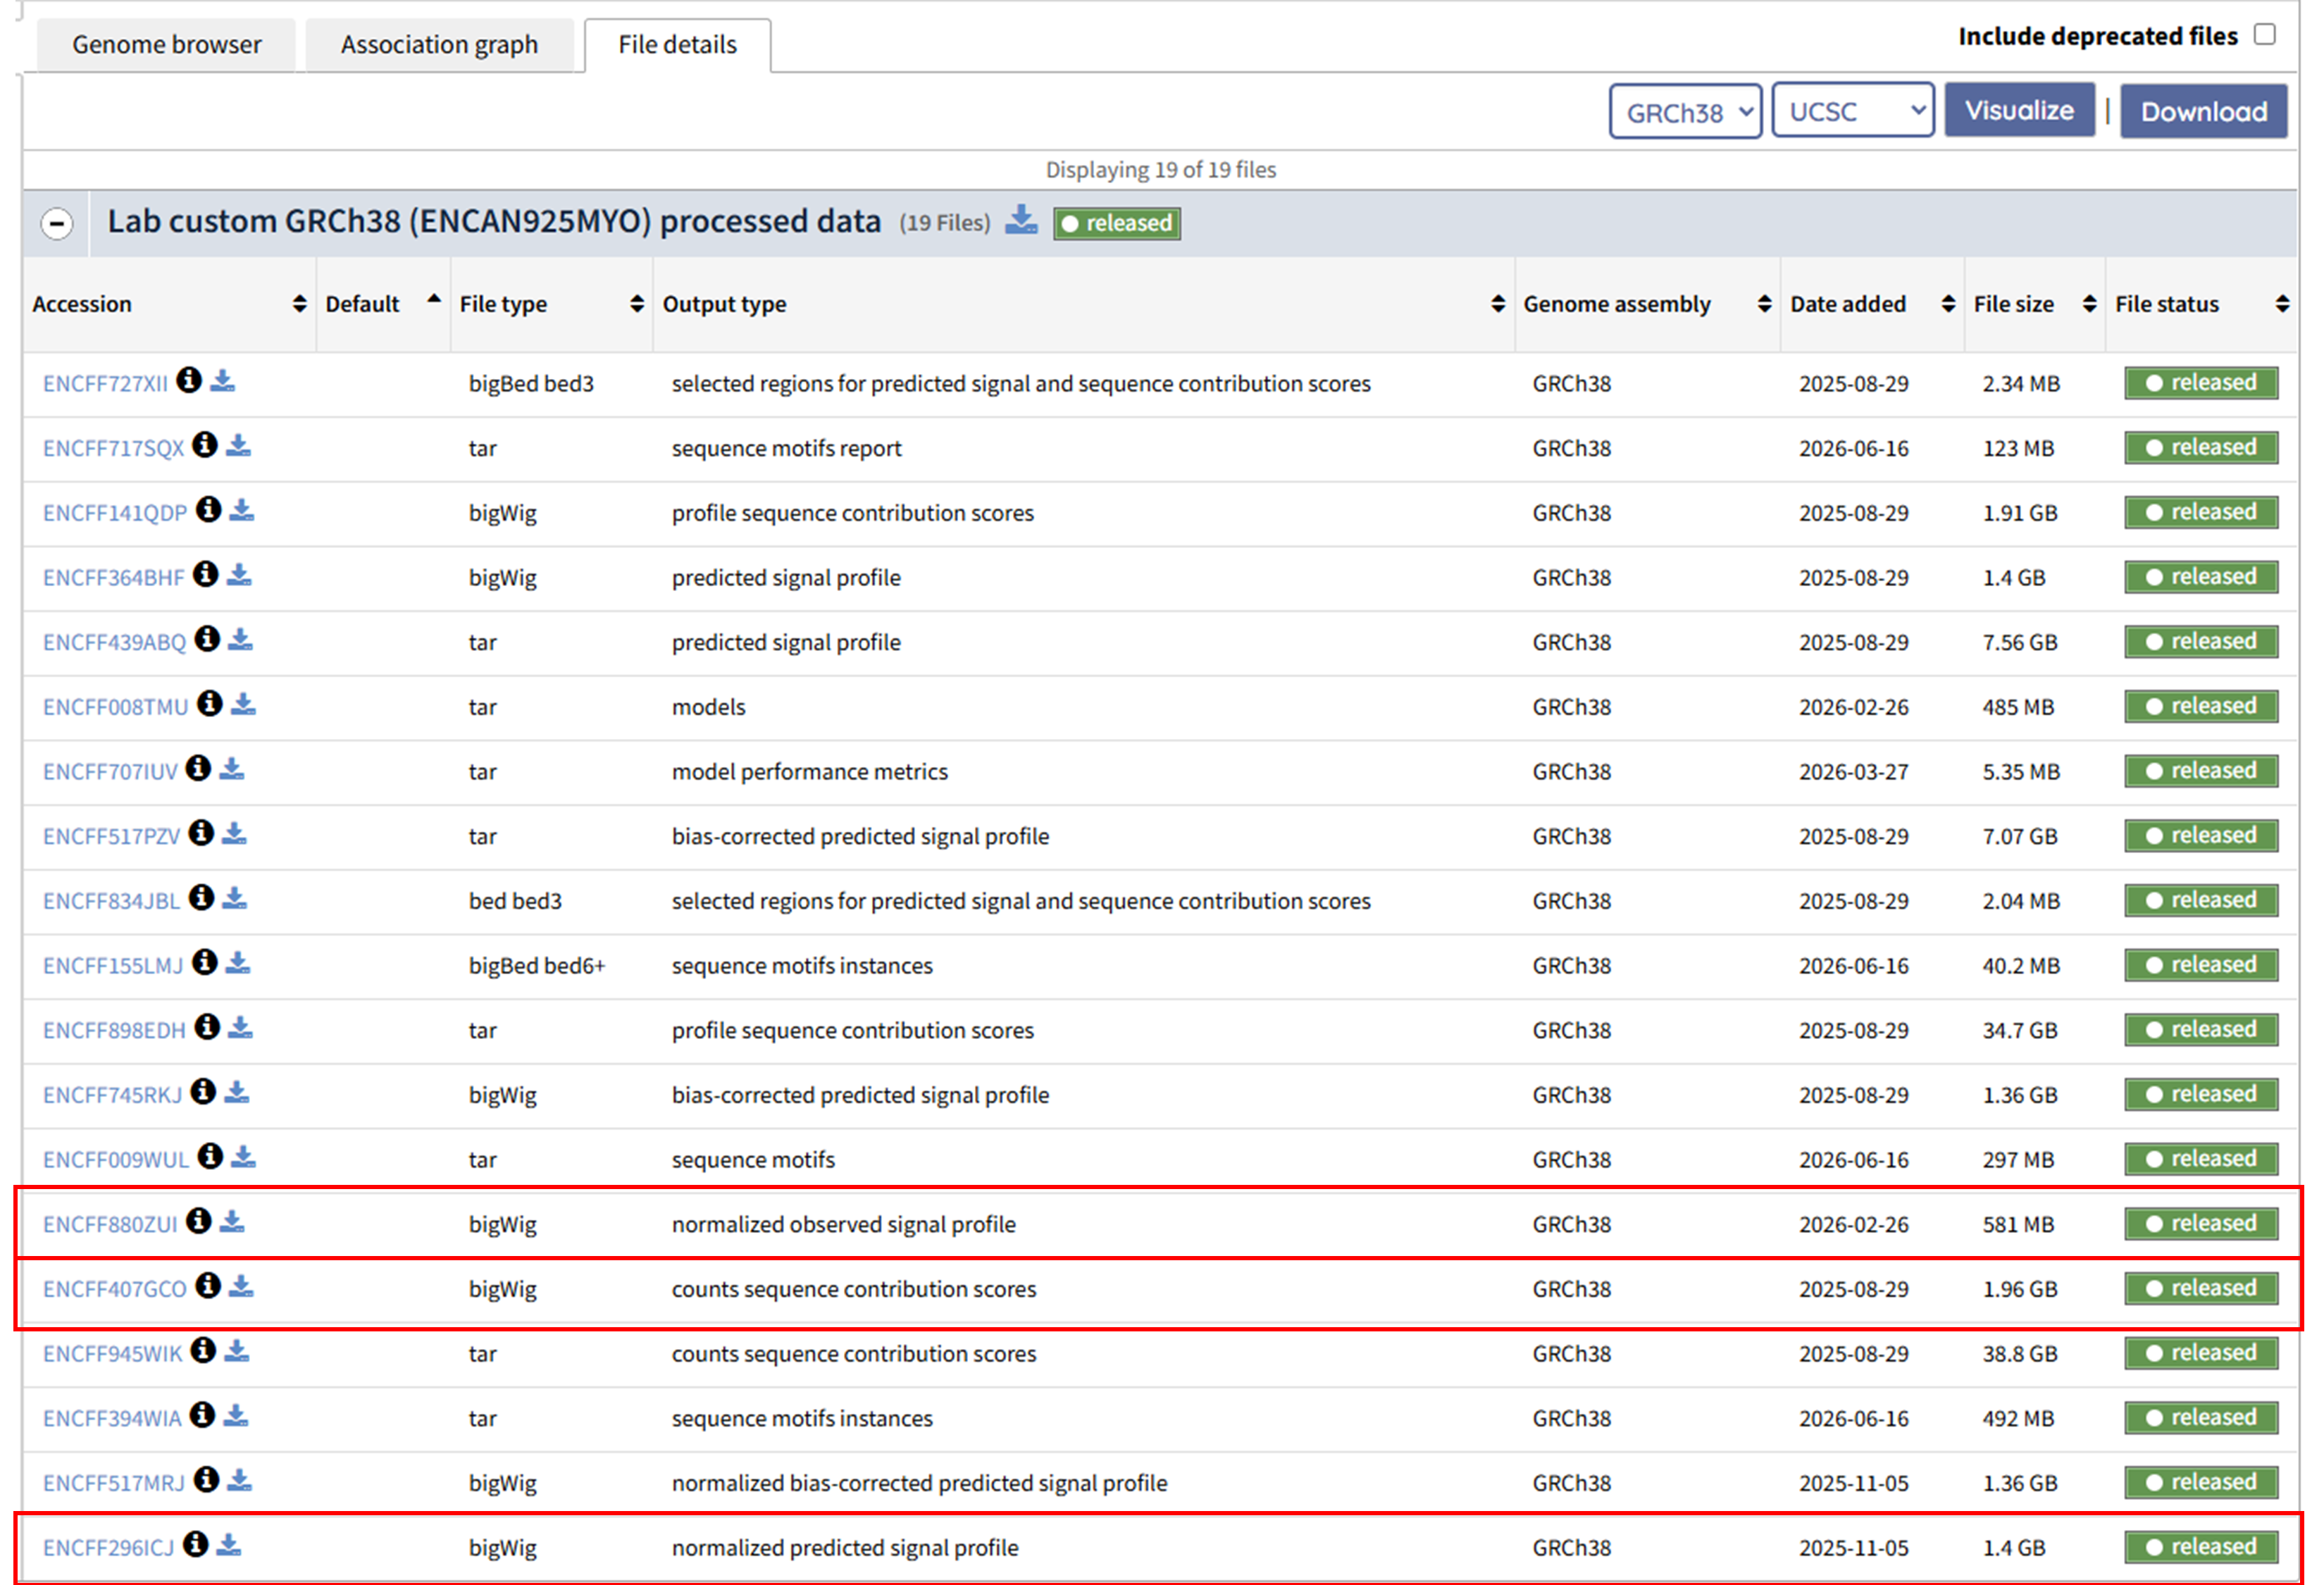
The following steps require the URLs of these bigWig files. Right-click the download icon beside a file and select Copy link address. The links for this example are provided here:
- Normalized observed signal profile: https://www.encodeproject.org/files/ENCFF880ZUI/@@download/ENCFF880ZUI.bigWig
- Normalized predicted signal profile: https://www.encodeproject.org/files/ENCFF296ICJ/@@download/ENCFF296ICJ.bigWig
- Counts sequence contribution scores: https://www.encodeproject.org/files/ENCFF407GCO/@@download/ENCFF407GCO.bigWig
This quickstart focuses on these three tracks. Additional ENCODE GRAMMAR products, including predictive motif-instance annotations, can be accessed through the ENCODE Portal and the UCSC Track Hub linked below.
For descriptions of the complete collection of files and model-derived products, see the ENCODE GRAMMAR overview and the ENCODE 4 preprint.
Step 3: Load the bigwigs into the WashU genome browser
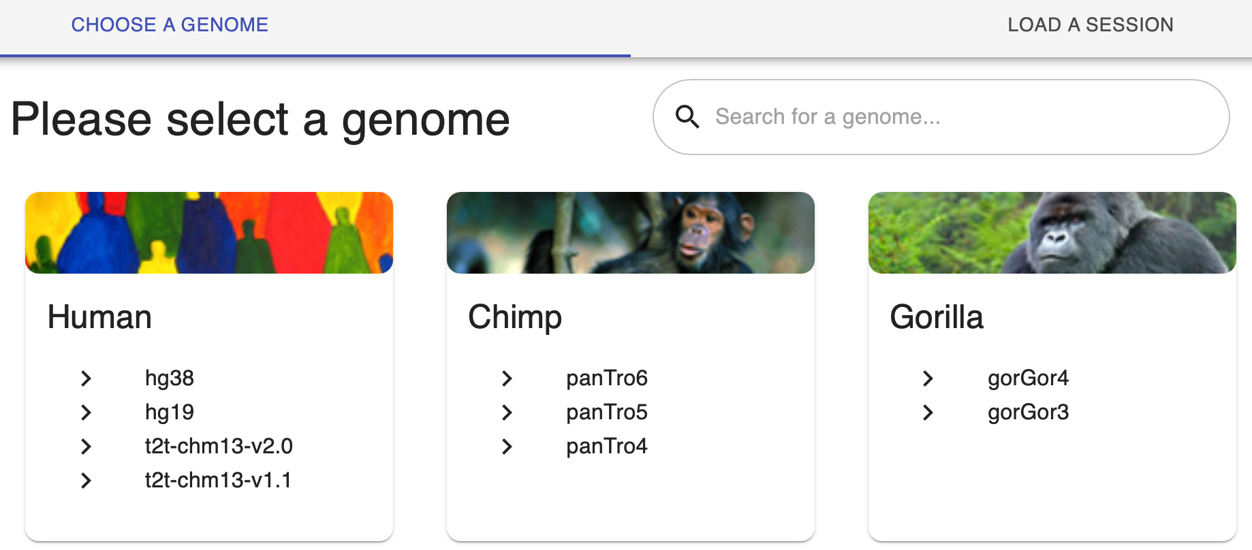
Navigate to the WashU Epigenome Browser. On the home page, find the Human section and select hg38 to open a new browser session.
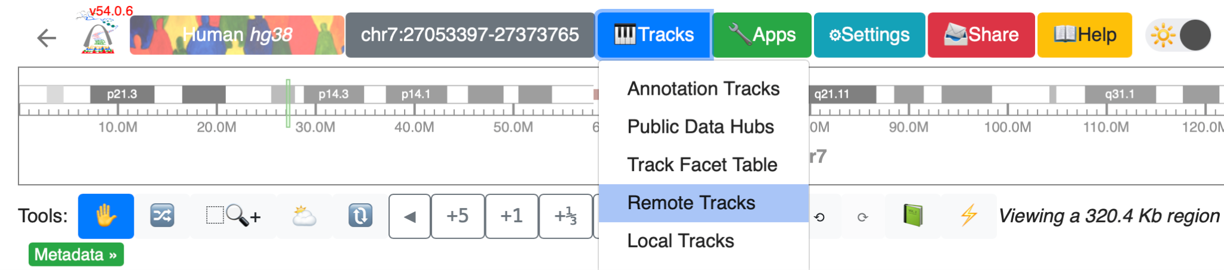
In the new browser session, select the Tracks icon at the top of the page and then choose Remote Tracks from the dropdown menu.
A window for adding remote tracks will appear:
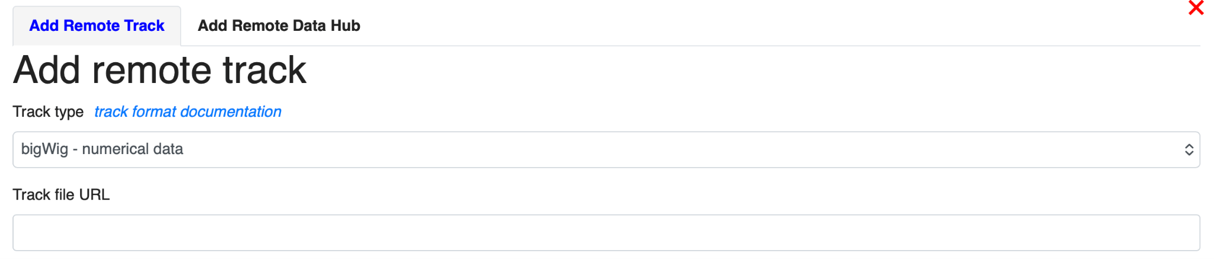
First, add the normalized observed signal profile and normalized predicted signal profile:
- Copy and paste the first URL from Step 2.
- Add an informative label, such as
Observed accessibility. - Click Submit.
- Click Add another track and repeat the process for the predicted profile, using a label such as
ChromBPNet predicted accessibility.


For the third bigWig—the counts sequence-contribution scores—change the track type to Dynseq. Select the Track type menu and choose Dynseq (dynamic sequence) from the list.
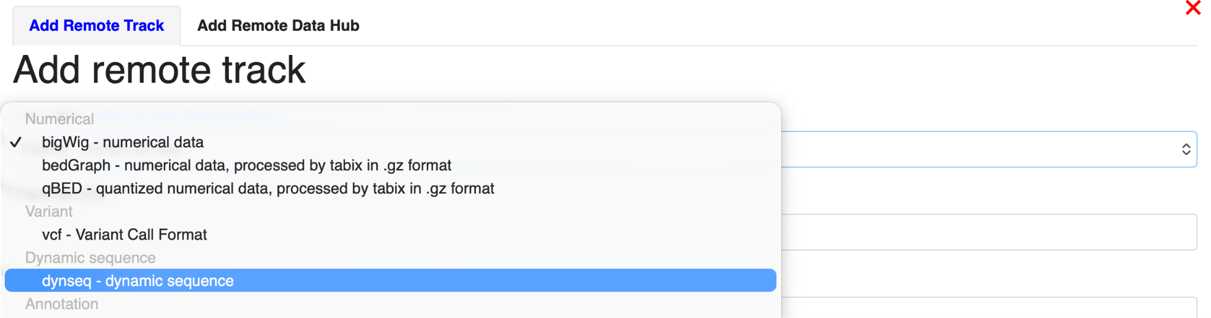
Dynseq displays each nucleotide as a letter whose height and direction reflect its contribution score. Positive scores indicate bases that increase the model prediction relative to the reference, whereas negative scores indicate bases that decrease it. The nucleotide letters appear only after zooming in sufficiently. Clusters of bases with large contribution scores often correspond to predictive regulatory sequence features, including transcription-factor motif instances.
Add an informative label, such as Counts sequence-contribution map, and submit the track.
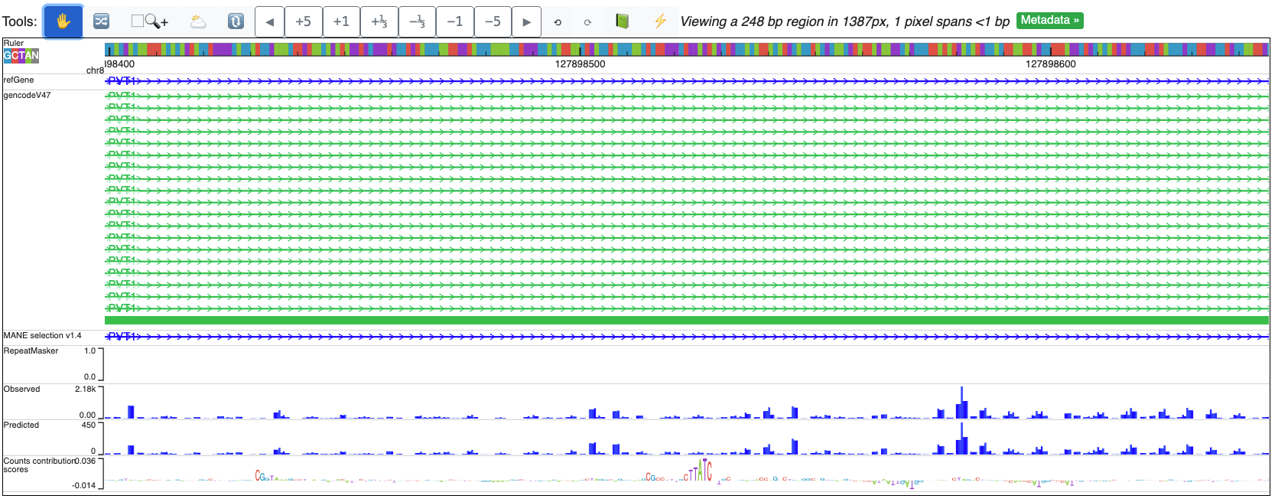
The completed browser session should resemble the example below, with the experimentally observed profile, model-predicted profile, and sequence-contribution map aligned at the same genomic locus:
For more information about configuring tracks, navigating loci, and sharing sessions, see the WashU Epigenome Browser documentation.
How else can I use the resources?
All ENCODE data, model sets, and model-derived sequence annotations are openly available through the ENCODE Portal. The complete ENCODE GRAMMAR resource contains 3,865 experiment-specific model sets spanning TF binding, chromatin accessibility, transcription initiation, and high-throughput reporter activity.
Additional access points include:
- Model-sets and sequence annotations: Browse released BPNet model sets, ChromBPNet model sets, ProCapNet model sets, and ReporterNet model sets on the ENCODE Portal.
- HuggingFace model zoo: Download ENCODE GRAMMAR models from Hugging Face.
- Predictions and sequence annotations: Explore model predictions, sequence-contribution maps, and predictive motif instances through the UCSC Track Hub.
- Unified motif lexicon: Access the ENCODE Motif Compendium, which organizes related predictive motifs discovered across all ENCODE GRAMMAR models.
- Software: Train and interpret new models using the open-source BPNet, ChromBPNet, and ProCapNet repositories.
- User guide: We are developing an interactive guide to help users navigate and interpret the resource (work in progress).
- Overview and publications: Read the ENCODE GRAMMAR overview, ENCODE 4 preprint, the BPNet paper, ChromBPNet preprint and ProCapNet preprint for additional detail.
This quickstart covers only one way to explore the resource. Future (weekly) posts in this series will describe how to interpret sequence-contribution maps, compare predictive motifs across cellular contexts, and use the models to estimate the molecular effects of noncoding genetic variants.
References
- The ENCODE Project Consortium et al. The Encyclopedia of DNA Elements. bioRxiv 2026.07.06.731365 (2026) (https://doi.org/10.64898/2026.07.06.731365)
- Yun, C. M. et al. A unified lexicon of predictive DNA sequence motifs from ENCODE transcription factor binding and chromatin accessibility assays. (2025) doi:10.5281/zenodo.17179111. (https://doi.org/10.5281/zenodo.17179111)
- Avsec, Ž. et al. Base-resolution models of transcription-factor binding reveal soft motif syntax. Nat Genet 53, 354—366 (2021). (https://doi.org/10.1038/s41588-021-00782-6)
- Pampari, A. et al. ChromBPNet: bias factorized, base-resolution deep learning models of chromatin accessibility reveal cis-regulatory sequence syntax, transcription factor footprints and regulatory variants. bioRxiv 2024.12.25.630221 (2024). (https://doi.org/10.1101/2024.12.25.630221)
- Cochran, K. et al. Dissecting the cis-regulatory syntax of transcription initiation with deep learning. bioRxiv 2024.05.28.596138 (2024). (https://doi.org/10.1101/2024.05.28.596138)
- Shrikumar, A., Greenside, P. & Kundaje, A. Learning Important Features Through Propagating Activation Differences. arXIV (2019).(https://doi.org/10.48550/arXiv.1704.02685)
- Lundberg, S. M. & Lee, S.-I. A unified approach to interpreting model predictions. in Proceedings of the 31st International Conference on Neural Information Processing Systems 4768–4777 (Curran Associates Inc., Red Hook, NY, USA, 2017). (https://dl.acm.org/doi/10.5555/3295222.3295230)
- Shrikumar, A. et al. Technical Note on Transcription Factor Motif Discovery from Importance Scores (TF-MoDISco) version 0.5.6.5. arXiv (2020) (https://doi.org/10.48550/arXiv.1811.00416).
Comments
Add your reaction or comment below.