Alan Murphy, Ekin D. Aksu and Selin Jessa contributed equally. Corresponding authors: Peter K. Koo (koo@cshl.edu) and Anshul Kundaje (akundaje@stanford.edu).
Introduction
Understanding how cells regulate gene expression is a longstanding challenge in biology. Transcription depends on interactions between cis-regulatory DNA, trans-acting factors such as transcription factors (TFs) and cofactors, and chromatin state1. These interactions allow cells with nearly identical genomes to maintain distinct identities and respond to developmental and environmental signals. A sequence change may alter transcription only when particular regulators are active2, while changing regulator activity can affect many loci and initiate further regulatory responses3. A predictive understanding of these relationships would connect genetic variation to its cellular consequences and support the design of interventions that alter gene expression in specific contexts. The possible combinations of sequences, regulator activities, and cellular conditions far exceed what experiments can exhaustively measure, motivating AI models that learn from available data to predict regulatory activity in unmeasured conditions and responses to new interventions.
AI modeling of gene regulation has developed along two largely separate directions, one centered on regulatory DNA sequence and the other on cellular state. Regulatory sequence modeling uses sequence-to-function (seq2func) models to predict molecular measurements, including chromatin accessibility and gene expression, from DNA4,5. These models support variant-effect prediction and the design of regulatory sequences with specified activities6,7. Model interpretation can also help decipher cis-regulatory grammar by examining how the identity, spacing, and combinations of TF-binding sites contribute to regulatory activity8. Cell state models learn representations from molecular profiles, primarily gene expression, to characterize cellular variation9. These representations support cell type annotation and integration across datasets, helping identify cell populations and expression programs associated with development or disease. Models trained on perturbation measurements aim to predict responses to genetic or pharmacological interventions10. Extending these capabilities to new combinations of sequence and cellular state requires predicting how the regulatory environment modifies sequence effects. In sequence-only models, each output is trained to predict a molecular readout in a specified cellular context, while transcriptomics-based cell state models generally leave regulatory DNA implicit.
Emerging approaches have begun to connect sequence and cell state modeling by conditioning sequence predictions on cellular measurements or incorporating sequence information into models of cellular regulation11–16. Joint models could, in principle, predict how a variant’s effect depends on regulator abundance or activity and how the response to a regulator perturbation depends on regulatory sequence. Learning regulatory relationships shared across loci and cellular states could extend these predictions to sequence–context combinations not observed during training. These capabilities would support identifying the cellular contexts and mechanisms through which disease-associated variants act, designing regulatory sequences with specified activities across cellular states, and selecting regulator interventions that alter gene expression in a given genetic background. Grounding these models in cellular dynamics could help predict how regulatory effects propagate over time and whether interventions produce lasting changes in cellular state.
Here, we review emerging approaches that connect regulatory sequence with cellular state to predict context-dependent gene regulation. We examine which cellular measurements provide context, how sequence and context are represented, and how their representations are combined. We then consider how training data support learning regulatory relationships, how evaluation tests their predictive value across sequences and cellular states, and how interpretation generates mechanistic hypotheses for experimental testing. Finally, we discuss how grounding models in cellular dynamics, guiding data acquisition through scaling studies, and using AI agents for model development, interpretation, and experimental design could accelerate their development and expand their biological applications.
Interplay between regulatory sequence and cellular state
Transcriptional output of a gene depends on its cis-regulatory sequence, the trans-regulatory environment, and local chromatin features1 (Figure 1). Here, cell state includes the chromatin environment and the abundance and activity of trans-acting regulators.
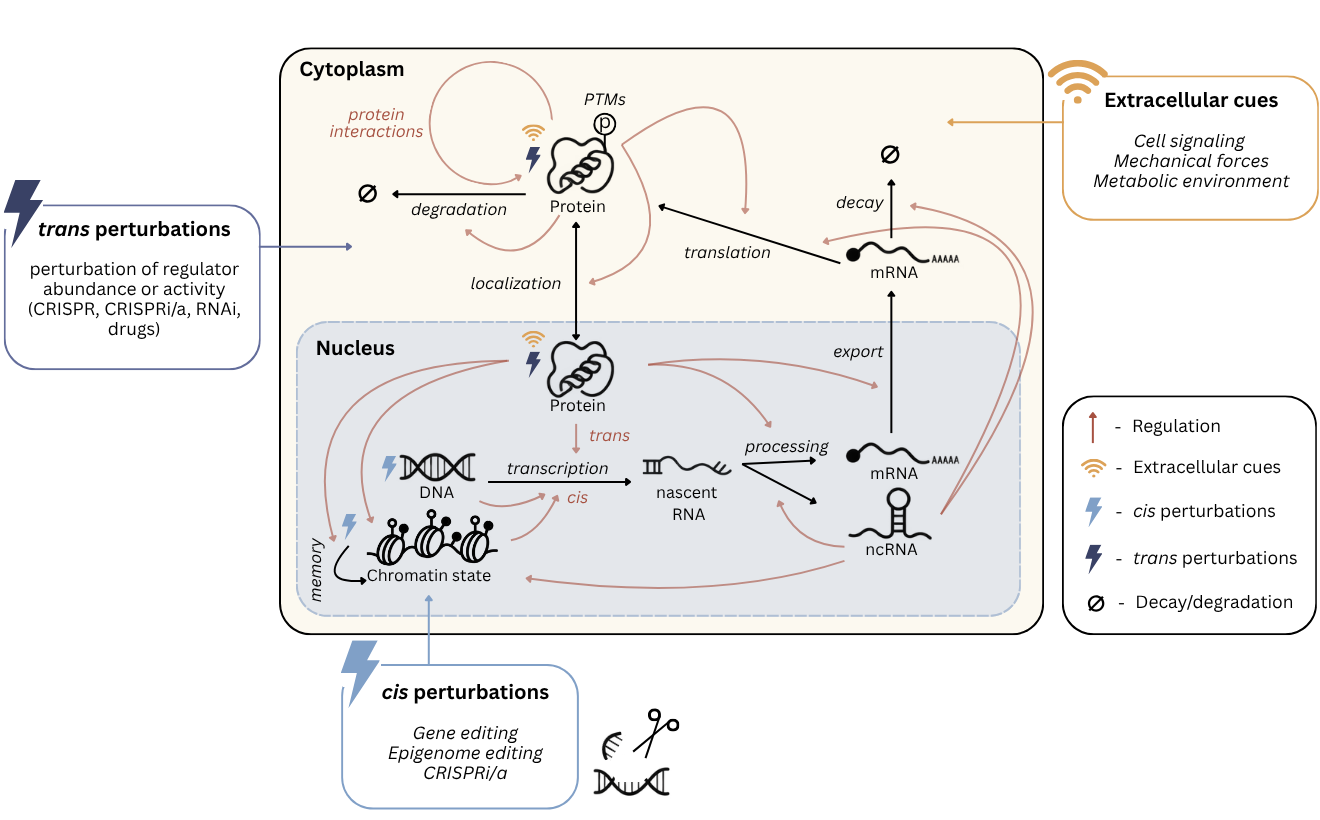
The trans-regulatory environment includes TFs, cofactors, chromatin regulators and regulatory RNAs that act in trans. Their regulatory effects depend on their abundance, interactions with molecular partners, biochemical state and subcellular localization19,20. For proteins, post-translational modifications such as phosphorylation and changes in localization can alter activity without a corresponding change in RNA abundance21,22. Extracellular signals and mechanical or metabolic cues can modify these properties, allowing the trans-regulatory environment to change as cells respond to their surroundings23–25.
Cis-regulatory elements (CREs) are DNA sequences that regulate transcription of genes on the same DNA molecule. Their effects depend on the regulatory proteins they recruit and their interactions with other regulatory elements. CREs include promoters, which support transcription initiation, and enhancers, which can modulate transcription from target promoters over short or long genomic distances1. Within individual elements, TF binding depends on both the recognized motif and its local sequence context. Flanking nucleotides, for example, can influence binding affinity through direct DNA contacts and effects on DNA shape and flexibility26,27. Surrounding sequence can also tune binding through weak interactions that locally enrich TFs, as observed for short tandem repeats28. Binding by one TF can also influence the occupancy of other factors through cooperative or competitive interactions. These interactions can depend on the identities and affinities of the binding sites, their spacing and orientation, and the concentrations of the available TFs20,29,30. The same regulatory sequence can therefore support different binding configurations as regulator availability changes.
The chromatin state includes nucleosome organization, chromatin accessibility, histone modifications, DNA methylation, and three-dimensional genome organization31. These properties influence regulatory-factor binding and communication between regulatory elements, while being shaped by DNA sequence and regulator activity. Nucleosomes can restrict access to binding sites, although some TFs can bind nucleosomal DNA32. DNA methylation can increase or decrease binding affinity depending on the TF and sequence33. TFs can in turn recruit histone-modifying enzymes and nucleosome remodelers through their effector domains, helping establish or alter accessibility and transcription34,35. At larger genomic scales, three-dimensional organization influences communication between distal enhancers and promoters36. Sequence-dependent changes in regulator expression can in turn alter the trans-regulatory environment at other loci, connecting regulation of individual genes to changes in cellular state37.
Regulatory measurements reflect the combined effects of sequence, chromatin, and the trans-regulatory environment. Comparisons that hold sequence or environment constant help distinguish these contributions. Testing the same sequence features across cellular states reveals whether their contributions change with context. At the Drosophila shavenbaby locus, enhancer dissection showed that some TF-binding sites contribute to expression in both embryos and pupae, whereas others have stage-specific contributions38. Comparing different sequences in a shared environment addresses the contribution of sequence variation. In F1 hybrids, parental alleles share the same trans-acting factors, so allelic differences in expression or TF binding support cis-regulatory effects. Comparing these differences with those between the parents helps identify contributions from their distinct trans environments39,40.
Interpreting these comparisons requires specifying which molecular quantity is measured. Nascent RNA assays report ongoing transcription, whereas conventional RNA sequencing measures RNA abundance, which also depends on processing and decay41. When RNA profiles are used to characterize cellular state, regulator RNA abundance does not necessarily reflect the corresponding protein abundance or activity. Following irradiation, p53 protein levels oscillate through changes in protein stability while TP53 mRNA remains unchanged42. Expression of downstream targets may provide indirect evidence of this response, but the regulator’s own RNA abundance does not report the protein dynamics driving it.
Destructive sequencing assays also leave individual-cell transitions unobserved. Combining genetic perturbations with single-cell RNA sequencing links expression profiles to interventions on specific genes43, but control and perturbed conditions generally contain different measured cells. Measurements at successive time points reveal changes in expression distributions, while connections between individual cells’ earlier and later states must be inferred44.
Computational models of gene regulation
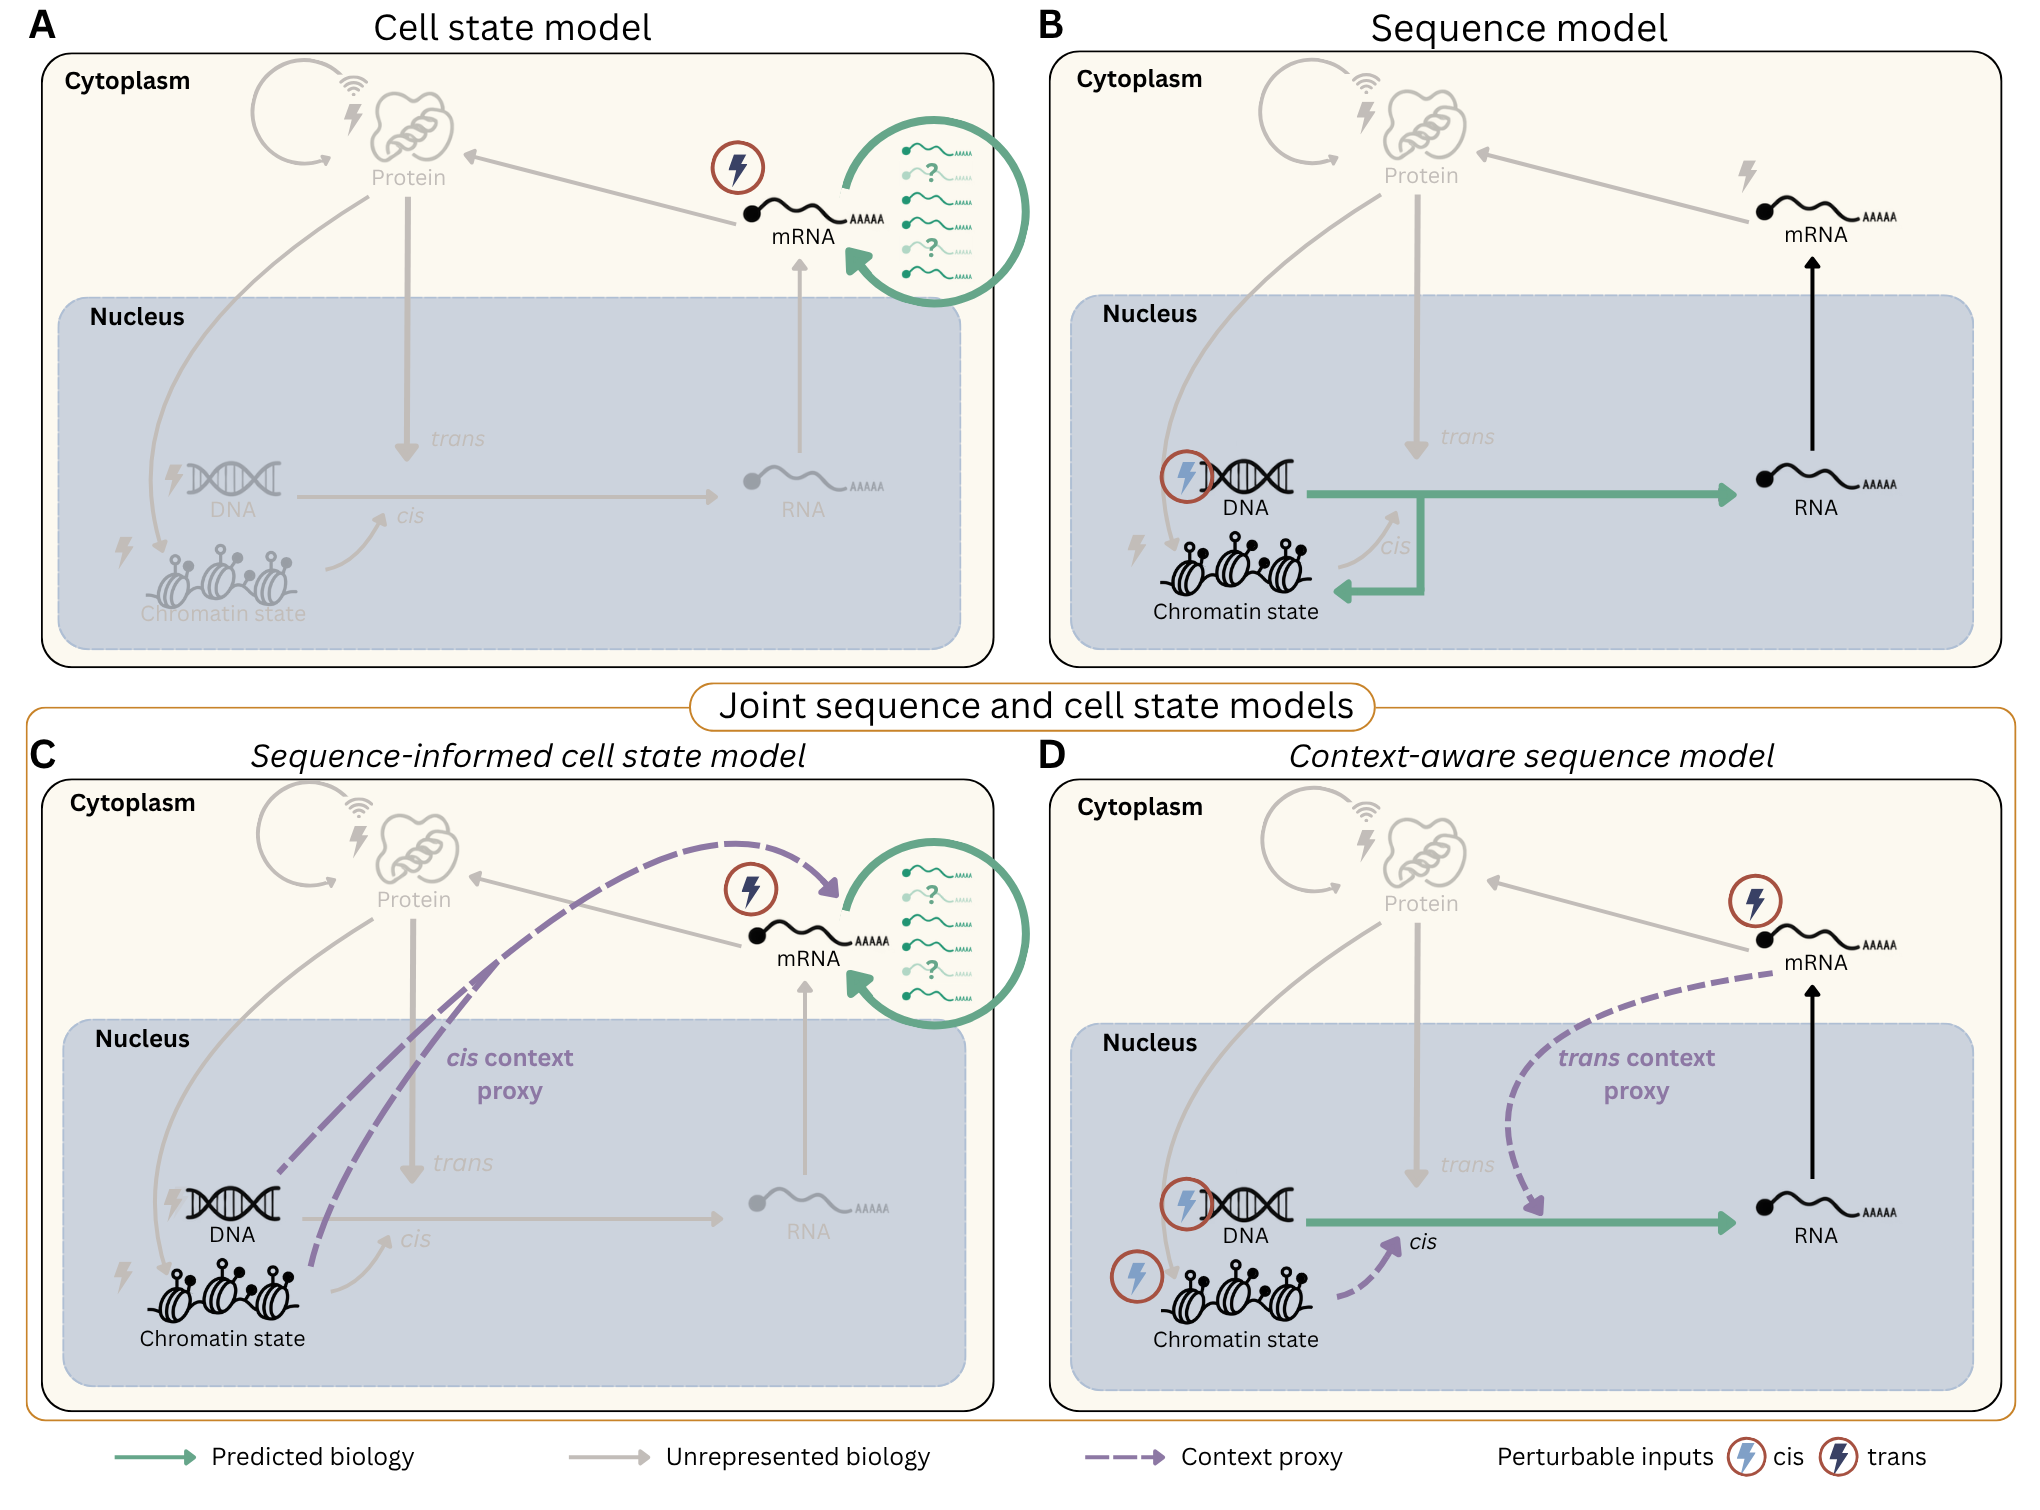
Computational modeling of gene regulation has developed along two largely separate directions, focused on cellular state and regulatory sequence (Figure 2a,b). We review their applications and the evidence for their ability to predict molecular activity and perturbation responses across sequences and cellular conditions.
Cell state models
Cell state models use molecular profiles to characterize cell types45,46, compare cellular states across datasets and conditions47,48, impute missing measurements49,50, and predict responses to interventions51,52. Due to the abundance of single-cell RNA-seq (scRNA-seq) data, most models learn from transcriptomic profiles of individual cells, capturing coordinated expression patterns associated with cell identity and physiological state. Many recent cell state models learn latent representations (i.e., embeddings) by reconstructing cellular profiles, predicting masked expression values, or using contrastive objectives that bring selected pairs of related profiles closer in representation space while separating other pairs53–55. Transcriptomic profiles provide an indirect view of the regulatory environment, while regulatory DNA and regulator protein abundance and activity generally remain implicit (Figure 2a).
Comparing cellular states across datasets requires accounting for technical differences among samples. For example, scVI47 uses a variational autoencoder to model RNA counts through a latent cellular representation together with library size (the total measured counts per cell) and covariates identifying experimental batch. To support transfer of cell-type annotations and comparison of disease-associated states with reference populations, scArches48 uses transfer learning to map new datasets into pre-trained reference space that can be obtained using existing models like scVI. Across species, similarities among encoded proteins can help relate expression profiles whose gene repertoires differ56,57. SATURN combines protein representations with expression to learn weighted gene groups, termed macrogenes, that provide shared features for comparing cell types across species58.
Single-cell foundation models (scFMs) aim to learn representations that support multiple downstream tasks by learning expression relationships across broad collections of scRNA-seq data53. Pretrained representations can place newly measured cells alongside characterized reference populations or retrieve similar cells from other studies in a zero-shot fashion without updating model parameters, helping identify cell types and states that recur across tissues or conditions56,59. For supervised tasks, pretrained embeddings can serve as fixed inputs to a task-specific predictor, or the model can be adapted through fine-tuning, which updates some or all pretrained parameters for the new task. Geneformer and scGPT illustrate this transfer to cell type annotation, with Geneformer also supporting disease-state classification60,61.
The value of pretraining depends on the additional data and how the pretrained model is used. Controlled comparisons found that self-supervised pretraining on auxiliary datasets improved cell type annotation relative to training on the target dataset alone62. In evaluations without fine-tuning, Geneformer and scGPT embeddings showed no consistent advantage over scVI and simpler approaches fitted to the evaluation datasets for cell type separation and batch integration63. Increasing pretraining dataset size also produced diminishing gains in the tested scFMs, with plateaus varying by architecture and downstream task64.
Paired RNA and chromatin accessibility measurements65 extend cellular representations by relating expression patterns to the accessibility of regulatory elements. Models can learn shared representations from these measurements, allowing information from jointly profiled cells to support integration and imputation in datasets where one modality is missing66. Pretraining directly on accessibility profiles also provides representations for cell annotation and imputation67. These approaches incorporate measured variation in the chromatin environment while generally leaving the underlying regulatory sequences implicit.
Representations learned from observational data describe variation among cells, while perturbation measurements reveal how interventions change their expression programs. Perturbation-response models can be trained directly on intervention measurements52 or adapted from pretrained models using intervention identities and measured responses61. Models use different strategies for predictions beyond the interventions measured during training. For example, in CPA learned representations of constituent interventions are combined to predict new combinations68. In GEARS, prior knowledge of functional similarity of genes is used to relate genes not perturbed during training to genes with measured responses52,69. scFMs seek to exploit relationships learned during large-scale pretraining61.
In a benchmark comparing perturbed-gene representations, embeddings from functional protein interaction networks supported more accurate response predictions than embeddings from the tested scFMs and protein language models70. However, recent benchmarks have challenged claims of generalization to unseen genetic perturbations, finding that the evaluated deep learning models did not consistently outperform simple baselines that assign the same training-derived mean expression profile to unseen gene perturbations or predict unseen combinations by summing individual perturbation effects relative to control71,72. In these evaluations, metrics could reward expression changes shared across interventions, producing favorable scores even when intervention-specific responses were poorly predicted72. Positive-control analyses using measured responses showed that metric sensitivity affects these comparisons, with gains for some deep learning models becoming apparent when evaluation resolved perturbation-specific changes73.
A complementary challenge is predicting the effects of the same intervention across different cellular states. The State model uses cellular embeddings learned from observational data to support response prediction in contexts for which no perturbation measurements were supplied during training74. Within a given context, responses can also vary among cells, and predicting a mean profile leaves this variation unresolved. Distributional approaches aim to capture these differences by learning transformations between control and perturbed expression distributions75,76. Because single-cell assays generally measure different cells in each condition, the training data constrain population responses while leaving individual-cell transitions unobserved77.
Sequence-based models
Supervised seq2func models are trained to predict molecular measurements or functional annotations from DNA sequence (Figure 2b). Here, “function” refers to the molecular activity or property being modeled. Once trained, models can predict these properties for unmeasured sequences, supporting variant-effect prediction78,79, in silico experiments to interrogate the cis-regulatory syntax they have learned1,80–82, and the design of regulatory sequences with specified predicted activities83–85.
Single-task seq2func models predict a specified molecular readout in one cellular context, with training objectives tailored to the assay. For example, a reporter-activity task predicts the expression of a reporter gene driven by each tested regulatory sequence in a massively parallel reporter assay86–88. Models trained on TF-binding or chromatin-accessibility profiles can predict both the total signal and its distribution across nucleotide positions. These profiles provide supervision on where signal occurs relative to sequence features, information that is lost when each region is reduced to a binary label or aggregate count81,89. The measured profiles also reflect technical processes with their own sequence dependencies. ChromBPNet, for example, uses a separately trained model of the sequence preferences of Tn5 in ATAC-seq or DNase I in DNase-seq to distinguish assay bias from sequence contributions associated with chromatin accessibility90.
Multi-task seq2func models share sequence representations across assays or cellular contexts, with task-specific outputs predicting each molecular readout91,92. A TF-binding motif may inform predictions of TF occupancy, chromatin accessibility, and histone modifications, allowing evidence from several assays to shape a shared sequence representation. Basenji extended multi-task sequence modeling to quantitative epigenomic profiles and cap analysis of gene expression (CAGE) measurements along the genome93. Subsequent models, including Enformer94, Borzoi95, and AlphaGenome79, expanded the sequence context to make distal regulatory elements available for predicting target-gene expression. Single-cell atlases also provide training targets for sequence-only models. Decima predicts gene expression across cell types and conditions from DNA surrounding each gene96.
Genomic language models (gLMs) learn from genomes by reconstructing masked sequence or predicting successive nucleotides or nucleotide groups from preceding sequence97,98. Training across species can capture patterns of evolutionary constraint99, with some models using alignments to relate positions across homologous sequences100,101. These patterns can inform variant interpretation, particularly in coding and splice-associated regions99,100. Connecting them to regulatory activity in a specified cellular context generally requires functional supervision, supplied through fine-tuning102 or combined with continued sequence prediction, as in Nucleotide Transformer v3103. In regulatory benchmarks, the tested frozen or fine-tuned gLMs did not consistently outperform seq2func models trained directly on functional measurements104,105.
For seq2func models trained on reference-genome profiles, variant-effect prediction tests whether sequence–activity relationships learned across loci transfer to differences between alleles. ChromBPNet and CREsted predictions agree well with measured effects at chromatin accessibility quantitative trait loci (caQTLs) and with allele-specific accessibility differences90,106. In personal-genome expression benchmarks, however, models can achieve high correlations across genes within an individual yet struggle to predict differences among individuals for the same gene, sometimes predicting genetic effects in the wrong direction107–109.
For variants in distal regulatory elements, predicting expression effects also requires learning which genes those elements regulate and how strongly they contribute to expression110,111. Earlier benchmarks found that Enformer captured many promoter determinants but underestimated distal enhancer effects112. Recent benchmarks show that improved enhancer–gene link identification can coexist with inaccurate estimates of regulatory effects. AlphaGenome identified enhancer–gene links more accurately than Borzoi79. Predicted expression changes from in silico enhancer disruption in AlphaGenome and other tested models were substantially smaller than those measured by CRISPR interference (CRISPRi) at experimentally supported links, with larger discrepancies at greater enhancer–promoter distances113. AlphaGenome’s predictions of expression quantitative trait locus (eQTL) effects likewise became less accurate with increasing distance from the target transcription start site79.
Sharing sequence features across cellular contexts introduces tradeoffs in both predictive accuracy and interpretation. In chromatin accessibility models, strong predictions at broadly accessible regions can mask poorer performance at cell-type-specific regions114. Shared representations can also introduce feature leakage. A motif learned from accessible regions in one cell type can acquire a negative contribution in another because it helps distinguish their accessibility patterns, even when the TF associated with the motif is absent from the second cell type. Interpreting that contribution as repression by the TF would assign a biological mechanism to an association learned across training tasks. In a CREsted model, positive E-box contributions in interneurons and negative contributions in excitatory neurons were consistent with this failure mode115. Training separate models removes this route for transferring feature associations across cellular outputs, while forgoing shared learning across tasks.
Joint sequence and cell state models
Joint sequence and cell state models connect regulation at individual loci with expression programs across genes. Sequence-informed cell state models use features of regulatory DNA to constrain regulatory relationships or predict expression from cellular measurements. Context-aware seq2func models condition predictions from nucleotide sequence on measurements or representations of cellular state (Figure 2c,d). A goal of joint modeling is to predict how sequence effects change with cellular state and how regulatory sequence shapes responses to regulator perturbations. Learning these dependencies could support predictions for sequence–context combinations that have not been measured together.
One use of sequence information is to constrain gene regulatory networks (GRNs), which describe relationships between regulators and their targets. Co-expression programs and regulator–target associations inferred from expression nominate relationships116,117, while potential TF-binding sites provide sequence evidence for candidate connections. SCENIC uses motif enrichment to refine expression-derived relationships into regulons comprising a TF and its candidate target genes, and scores their activity through enrichment of those targets among highly expressed genes in each cell118. Chromatin accessibility extends this framework through candidate regulatory elements. Motif matches in accessible regions nominate TF–element links, while proximity and associations between accessibility and expression support element–gene links14,15,119.
Some GRN approaches also fit predictive relationships between regulators, regulatory elements, and target-gene expression. Pando models products of TF expression and accessibility at motif-containing regions, allowing the modeled contribution of a TF to depend on both its expression and accessibility at its candidate binding sites120. DeepSCENIC learns TF–element binding potentials from pretrained sequence representations and combines them with TF expression to predict accessibility and target-gene expression16. In these approaches, sequence helps specify potential regulatory connections, while cellular measurements help estimate their contributions to expression.
Fitted networks can also be used to predict how regulator perturbations affect expression across genes. CellOracle propagates an imposed change in TF expression through a motif-constrained network fitted to unperturbed cells and projects the predicted expression changes onto a cell-state representation to estimate the direction of state shifts121. Its nomination of lhx1a as a regulator of axial mesoderm development was supported by loss-of-function experiments in zebrafish.
Sequence-informed expression prediction also extends to models that integrate features across regulatory elements without prescribing a regulator–target network. GET combines motif-based sequence features with cell-specific chromatin accessibility to predict expression122. Here, cellular context is supplied through the measured state of regulatory elements, allowing sequence-informed prediction without TF expression as an input.
Context-aware seq2func models incorporate cellular information directly into the mapping from nucleotide sequence to molecular measurements. Corgi uses regulator expression to condition predictions of expression and epigenomic profiles13, while scooby uses learned representations of cellular state to condition predictions of RNA and chromatin accessibility profiles12. Both approaches allow sequence features to be shared across cellular states while their predicted effects depend on the supplied context. Corgi predicts molecular measurements in held-out cell types. Its variant-effect predictions agreed more closely with measured effects when regulator-expression inputs matched the cellular context in which those effects were assayed than when the inputs were mismatched13. Scooby’s variant predictions correlated more strongly than those of the sequence-only model Borzoi with fine-mapped eQTL effects in the cell types profiled by OneK1K12,123, although differences in architecture and training prevent attributing that improvement specifically to context.
AlphaGenome 2 expands the training scale and biological coverage of this approach, accepting either learned embeddings for reference tissues and cell types or embeddings generated from supplied single-cell RNA-seq profiles124. On TenK10K single-cell eQTL benchmarks, it improved identification of regulatory variants and prediction of effect direction relative to the original AlphaGenome fine-tuned on single-cell data and to scooby124.
Accessibility, regulator expression, and learned cell representations can capture coordinated variation across cells, making them useful for activity prediction even when the contributions of individual regulators remain poorly resolved. Corgi’s authors reported limited sensitivity to individual regulator-input changes and did not obtain accurate zero-shot predictions in the regulator-perturbation evaluations they examined13. For networks fitted to unperturbed cells, predicting intervention responses requires the inferred regulator–target relationships to remain predictive when a regulator is perturbed. Evaluations across cellular states and regulator perturbations probe these different capabilities.
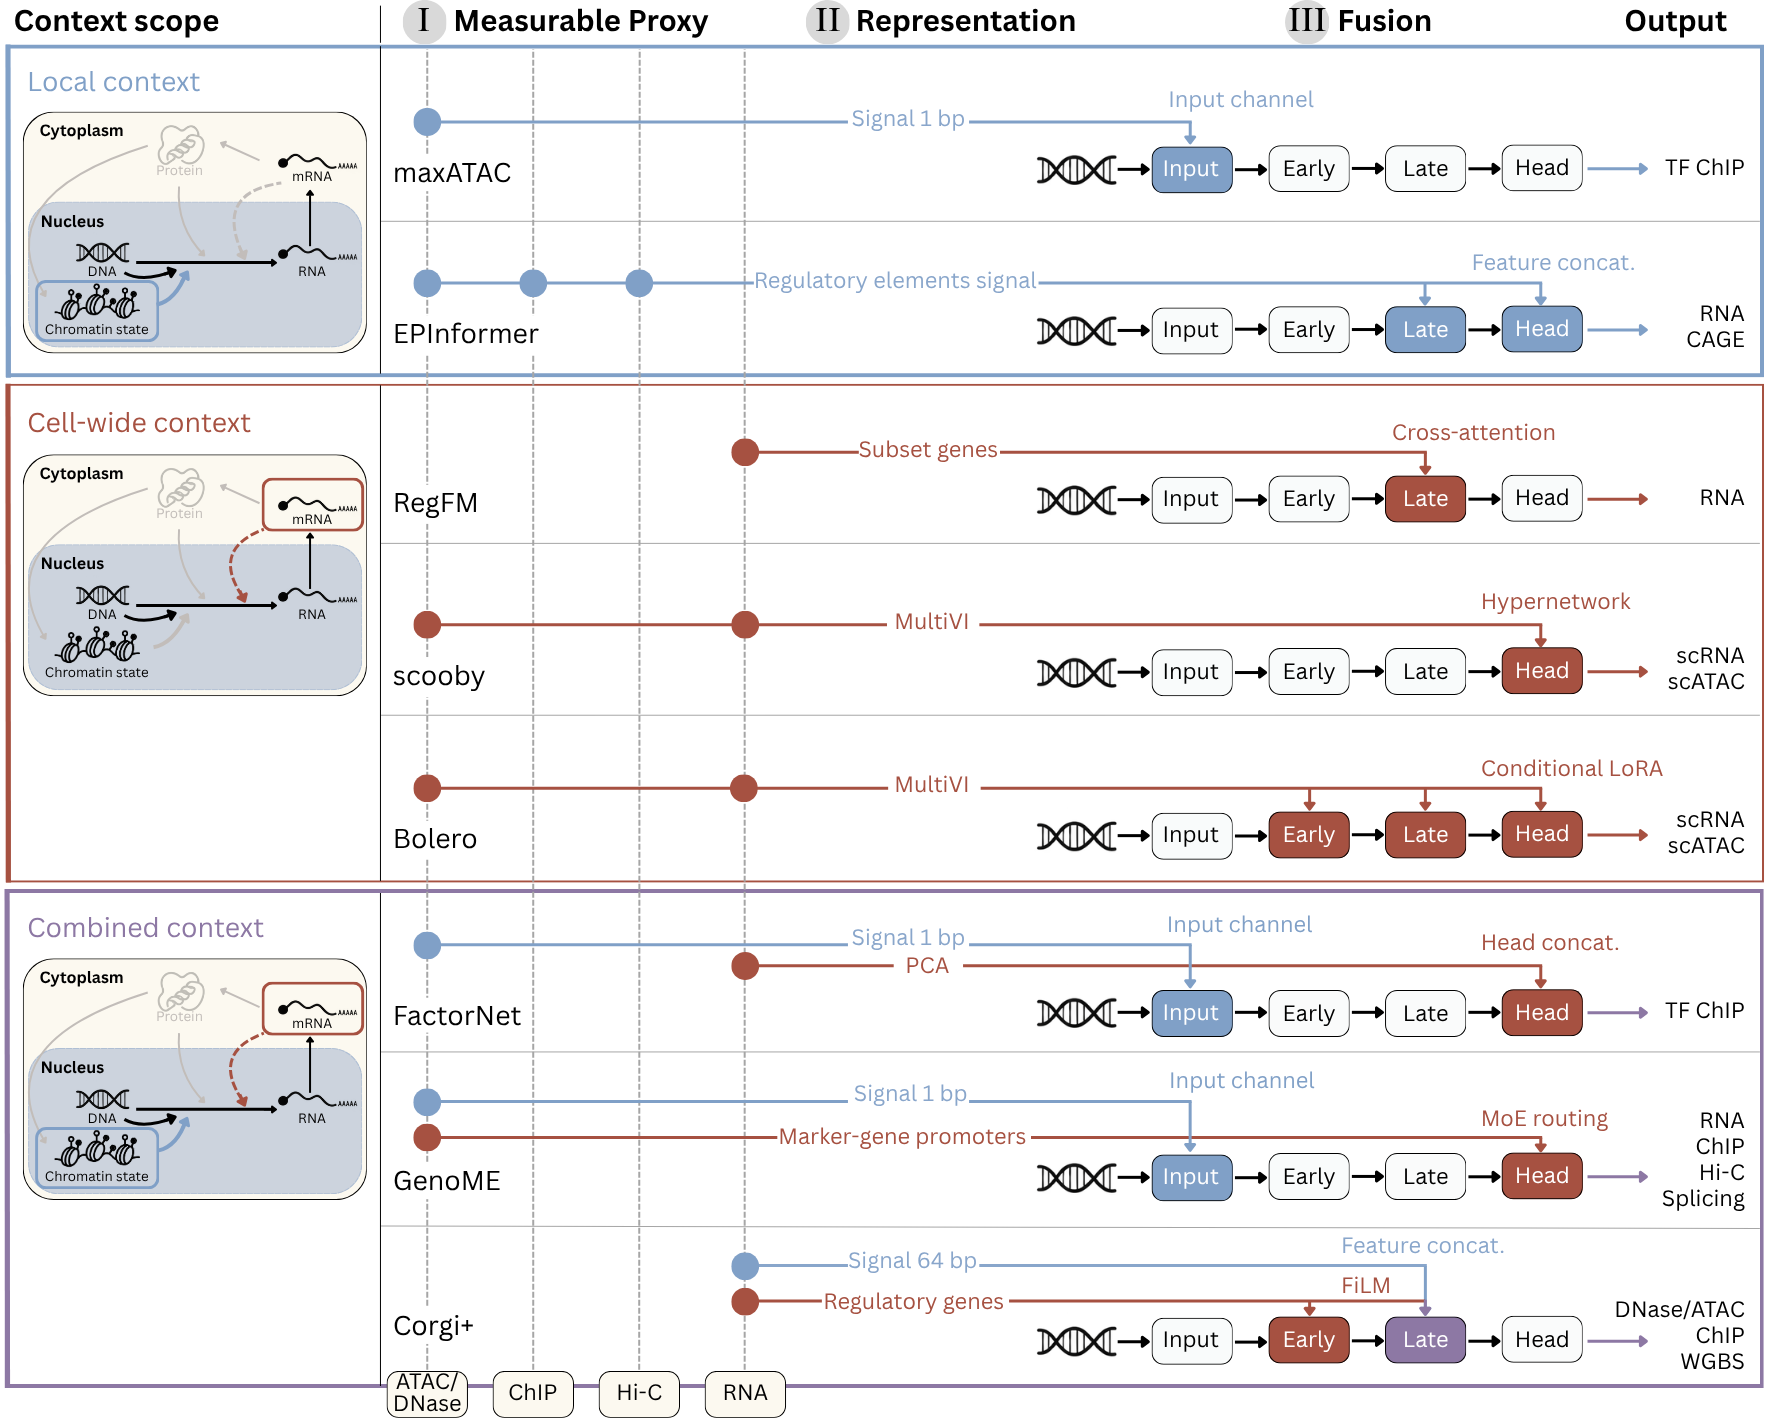
Across these approaches, predictive capabilities depend on what cellular inputs measure, which distinctions their representations preserve, and how those inputs modify predictions from sequence. We next examine how context measurements, sequence and context representations, and their fusion shape these predictions (Figure 3; Table 1).
Selecting measurements of cellular context
Measurements of cellular context capture different aspects of the regulatory environment. Transcriptome profiles are widely used and provide information shared across loci through regulator expression and the expression programs associated with regulator activity125. Regulator RNA abundance can diverge from protein abundance and activity, particularly during stimulation when these quantities can change on different timescales. Protein measurements provide more direct information about abundance, although low-abundance regulators, including many TFs, remain incompletely sampled by single-cell proteomic methods126.
Epigenomic measurements complement this cell-wide information by describing the regulatory state at individual loci. Chromatin accessibility is widely measured, while histone modifications and other chromatin features provide additional information about regulatory activity and can retain features of earlier stimulation127,128. Combining transcriptome and chromatin measurements can help distinguish cellular conditions that are difficult to resolve from either modality alone. Even jointly, these modalities provide a partial description of cellular state, with many aspects of regulator activity and signaling represented only indirectly.
The choice of context also determines which molecular quantities are supplied and which the model must predict. Expression models can condition predictions from promoter and enhancer sequences on measured enhancer accessibility129. Accessibility then supplies information about the outcome of TF binding and chromatin remodeling, allowing the model to use this regulatory state when predicting expression. For sequence perturbations, however, holding accessibility fixed can omit expression effects mediated through changes in accessibility. The appropriate context thus depends on whether the goal is to predict expression given a measured chromatin state or to predict how a perturbation changes that state and its downstream consequences.
Sequence and context representations
The same cellular measurements can be supplied to a model in different forms, preserving different levels of detail. Regulator expression vectors retain a separate value for each included gene13,130,131, while learned cell embeddings summarize patterns across expression or accessibility profiles12,132. These representations provide context shared across loci. Local chromatin measurements can remain organized as genomic signal tracks or be summarized over regulatory elements129,133. Tracks preserve spatial variation at the supplied resolution, while regional summaries retain selected properties of each element.
Cell embeddings learned independently of the sequence-prediction task may preserve broad differences between cell types while poorly resolving variation within a cell type that affects regulatory responses. A fixed embedding supplies the sequence predictor with only the cellular distinctions it retains. XChrom, for example, learns a transformation of fixed principal component analysis (PCA) coordinates of expression profiles134. This transformation can adapt how the retained components contribute to accessibility prediction, but cannot recover distinctions removed by the original projection. Training the encoder that maps the original measurements into a cell representation jointly with the sequence predictor allows the prediction objective to influence which cellular differences are retained.
The sequence representation determines which regulatory features are available to combine with this cellular context. Regional motif summaries, as used by GET, retain motif content while omitting the arrangement of sites within each region122. Features learned by seq2func models can encode relationships such as motif order and spacing. Pooling aggregates features across sequence positions into a coarser representation; these relationships can survive pooling if they have already been encoded in the aggregated features. Their retention depends on the encoder and the measurements and cellular conditions used for training. Features computed from DNA alone are shared across cellular states, with context-dependent effects modeled when sequence and context representations are combined. For variant prediction, motif-derived features or sequence embeddings must be recomputed from the altered DNA. Sequence changes that produce identical representations remain indistinguishable through that input.
Compressing sequence into a predicted activity value can discard distinctions needed under a different context. Two enhancers with different TF-binding motifs may have the same predicted accessibility in one state yet respond differently to altered TF activity. Passing only their initial accessibility values to a downstream predictor collapses this distinction, even if those values are accurate. Retaining sequence features alongside the activity estimate, or recomputing accessibility from sequence under the altered context, allows motif composition to contribute to the response prediction.
Fusion of sequence and context representations
Fusion specifies how a model uses cellular context to interpret regulatory sequence. A sequence representation may identify a potential TF-binding site, while the supplied cellular measurements provide information about the availability or activity of the corresponding regulator. Combining these inputs allows the predicted contribution of that site, and the effect of disrupting it, to vary across cellular states.
Two design choices describe this integration. The fusion stage specifies where context acts in the prediction pipeline. Early fusion introduces context at the input, intermediate fusion introduces it within the sequence encoder, and late fusion introduces it at the prediction head, the final layers that map encoded features to predicted molecular measurements (Figure 3; Table 1). The fusion operation specifies how context changes feature processing or prediction. A model can apply several operations at different stages, allowing context to influence both the construction of sequence features and their contribution to the output.
Concatenation places sequence and context features alongside one another as inputs to subsequent layers. In early fusion, local chromatin measurements can be aligned with DNA as additional input channels133,135. The encoder receives nucleotide information and measured signal at corresponding positions. Subsequent nonlinear layers can learn dependencies between sequence patterns and the surrounding chromatin state, such as how the predictive contribution of a motif varies with local accessibility. Concatenation can also be applied at the prediction head, combining encoded sequence features with cellular context for expression prediction, as in DeepCAGE131.
Multiplication provides a direct interaction between sequence and context features. Weighting a sequence-derived binding score by regulator expression makes the resulting feature depend on both the binding potential and the supplied regulator level136. Gating generalizes this approach through context-dependent scaling of features, while feature-wise linear modulation (FiLM) learns coefficients that both scale and shift them137. Corgi applies FiLM within the sequence encoder, using regulator expression to modulate features at multiple stages13. Later layers process these modified features, allowing cellular context to influence how sequence patterns are combined during encoding. AlphaGenome 2 similarly applies FiLM throughout its sequence encoder, transformer tower, and decoder124. Conditioning only the decoder or output layers did not consistently improve accuracy over an unconditioned multi-task model. Prediction of expression differences across conditions improved when conditioning extended to the transformer, with further gains from including the sequence encoder124.
Cross-attention allows different sequence regions to use different parts of the supplied context. When context contains separate regulator representations, sequence features can guide how strongly each regulator representation contributes at a particular region138. A cell-wide context can thus be used differently across loci according to their sequence features.
Hypernetworks use context to generate parameters for another component of the model139. In scooby, a hypernetwork generates output-layer weights from the cell embedding, implementing late fusion through a cell-dependent prediction head12. The same encoded sequence can consequently produce different predictions across cells. This approach allows sequence features to be reused across contexts, while requiring the shared encoder to preserve the distinctions needed by the different prediction heads.
Table 1. Context-aware sequence-to-function models, organized by the three design decisions. Models condition sequence-based predictions on measurements of cellular context. Models where sequence enters only as precomputed motif scores are not shown122,140. Rows are grouped by the class of context supplied, corresponding to design choice I in Figure 3. Representation (design choice II) is Signal (a measurement at the stated resolution), Subset (selected features) or Embedding (a learned or projected representation). Fusion (design choice III) gives the operation and location at which context enters. Input denotes early fusion, earlier backbone and later backbone denote intermediate fusion, and head denotes late fusion. Multiple locations are listed when context enters at more than one. DNA is the sequence input length, where n × a length denotes n separate elements. Models are selected to span the three design decisions. Further models supply local context141–148, cell-wide context149,150, or both151.
| Name | DNA | Context | Representation | Fusion | Output |
|---|---|---|---|---|---|
| Local context: signal measured at the target locus | |||||
| maxATAC | 1 kb | ATAC | Signal (1 bp) | Channel (input) | TF ChIP |
| EPCOT | 1.6 kb | DNase/ATAC | Signal (1 bp) | Channel (input) | ChIP, CAGE, RNA, Hi-C |
| C.Origami | 2.1 Mb | CTCF ChIP + ATAC | Signal (1 bp) | Concat. (later backbone) | Hi-C |
| Nona | 197 kb | DNase/CAGE outside the masked central region | Signal (1 bp) | Sum (later backbone, head) | DNase, CAGE |
| Puget | 192 kb | Hi-C | Embedding (HiCFoundation) | Sum (later backbone) | RNA |
| Chromnitron | 8.2 kb | ATAC | Signal (1 bp) | Concat. (later backbone) | TF ChIP |
| EPInformer | 61 × 2 kb | H3K27ac + DNase + Hi-C | Signal (per element) | Concat. (later backbone, head) | RNA, CAGE |
| Cell-wide context | |||||
| ChromDragoNN | 1 kb | TF RNA | Subset (1630 TFs) | Concat. (head) | DNase |
| Wnuk et al. | 0.6 kb | RNA | Subset (978 genes) | Concat. (head) | DNase |
| DeepCAGE | 1 kb | TF RNA | Subset (402 TFs) | Product with motifs, concat. (head) | DNase |
| EpiGePT | 128 kb | TF RNA | Subset (711 TFs) | Product with motifs, concat. (later backbone) | DNase, TF and histone ChIP |
| DragoNNFruit | 2.1 kb | scATAC | Embedding (50 d, LSI) | Hypernetwork, bias terms (later backbone) | scATAC |
| scooby | 524 kb | scRNA + scATAC | Embedding (14 d, MultiVI) | Hypernetwork, weights (head) | scRNA, scATAC |
| XChrom | 1.3 kb | scRNA | PCA → learned embedding (32 d) | Inner product (head) | scATAC |
| Bolero | 524 kb | scRNA + scATAC | Embedding (30 d, MultiVI) | Conditional LoRA (earlier and later backbone, head) | scRNA, scATAC |
| Melody-G | 10 kb | scRNA | Embedding (512 d, scGPT) | FiLM (later backbone) | CpG methylation |
| PanExonNet | 15/26 kb | Splicing-factor RNA | Subset (277) → embedding (16 d) | Weight modulation (earlier and later backbone) | Splicing, junctions |
| Corgi | 524 kb | regulatory-gene RNA | Subset (2891 genes) | FiLM (earlier and later backbone) | DNase/ATAC, ChIP, CAGE, RNA, WGBS |
| RegFM | 650 kb | regulatory-gene RNA | Subset (2103 genes) | Cross-attention (later backbone) | RNA |
| AlphaGenome 2 | 1 Mb | scRNA | Embedding (256 d, expression autoencoder) | FiLM (earlier and later backbone) | RNA, CAGE, ChIP, DNase/ATAC, WGBS, Hi-C, splicing |
| Local and cell-wide context | |||||
| FactorNet | 1 kb | DNase + RNA | Signal (1 bp) + embedding (8 d, PCA) | Channel (input); concat. (head) | TF ChIP |
| Enformer Celltyping | 197 kb | ATAC + ATAC at marker-gene promoters | Signal (128 bp, mean-subtracted) + signal (250 bp) | Concat. (head) | Histone ChIP |
| EpiBERT | 524 kb | Masked ATAC + motif enrichment | Signal (4 bp) + subset (693 motifs) → embedding (8 d) | Concat. (later backbone) | ATAC, RAMPAGE |
| GenoME | 1 Mb | ATAC + ATAC at marker-gene promoters | Signal (1 bp) + signal (250 bp) | Channel (input), MoE gating (later backbone, head) | RNA, ChIP, Hi-C, splicing |
| Corgi+ | 524 kb | Local RNA + regulatory-gene RNA | Signal (64 bp) + subset (2891 genes) | Concat. (later backbone); FiLM (earlier and later backbone) | DNase/ATAC, ChIP, WGBS |
TF, transcription factor; PCA, principal component analysis; LSI, latent semantic indexing; LoRA, low-rank adaptation; FiLM, feature-wise linear modulation; MoE, mixture of experts.
∗Chromnitron’s protein embedding represents the identity of the queried protein, not its abundance or activity.
†AlphaGenome 2 denotes its expression-conditioned configuration, in which a pretrained expression autoencoder encodes single-cell RNA-seq profiles and a learned adapter maps these embeddings into the condition space of the frozen sequence model. Its reference configuration instead uses learned embeddings for ontology-defined conditions supplied as identifiers rather than measurements.
‡FactorNet denotes its RNA-augmented configuration.
§EpiBERT masks ATAC during pretraining and predicts expression after fine-tuning.
¶GenoME supplies marker-promoter accessibility to decoder MoE gates; encoder MoE gates use local sequence–accessibility representations.
Learning and evaluating context-dependent regulatory relationships
Training data constrain which sequence–context relationships a model can learn. Assay design, sampling, and preprocessing shape the comparisons available to distinguish these relationships, while evaluation tests whether the resulting predictions transfer to new sequences and cellular conditions.
Training across datasets and modalities
Joint models can learn sequence and cell-state representations together with the fusion and prediction layers from data that link regulatory DNA and cellular context to a molecular readout. Separate pretraining extends the data available to each component. A sequence encoder can learn regulatory features from DNA paired with genome-wide functional measurements94,95, while a cell-state encoder can learn expression patterns from independently collected transcriptomic atlases60. Joint supervision still requires examples that link the supplied context to molecular activity at the corresponding locus. The pretrained encoders can remain fixed while the fusion and prediction layers are fitted, or be fine-tuned alongside them.
For accessibility prediction conditioned on RNA, paired assays associate accessibility at a locus with the expression profile of the same cell or nucleus65. Applying these assays to perturbed and control populations preserves that correspondence within cells, while intervention responses are estimated by comparing populations163,164. When assays profile different cells, matching populations across assays introduces uncertainty about which expression context belongs with an accessibility measurement. Pooling studies can broaden biological coverage, but even correctly matched profiles may carry protocol effects that survive normalization. If protocol coincides with cell type or intervention, the model can learn these differences as apparent context-dependent regulation165,166. Shared samples or biological conditions assayed across protocols help estimate these effects and assess whether correction preserves the regulatory differences of interest.
Constructing metacell or pseudobulk profiles within donors, conditions, and cell populations reduces sparsity while preserving comparisons among genetic backgrounds and interventions167,168. Even within these groups, pooling responding and unresponsive cells can dilute a response confined to a subset. For changes retained at that resolution, an auxiliary loss can penalize errors in predicted differences from matched controls or between intervention responses. This gives response errors explicit weight alongside errors in predicted expression or accessibility levels.
Experiments that resolve sequence–context dependencies
Cellular states differ in the expression and activity of many regulators, so a sequence’s response across states can reflect several regulatory changes acting together. Reporter libraries assayed across cell types measure responses to these different environments87. To test dependence on a particular regulator, intact and motif-disrupted sequences can be compared at several TF dosages. Their activity difference at each dosage estimates the edit’s effect; comparing that difference across dosages measures how the sequence effect changes with regulator availability. Repeating these comparisons across cellular backgrounds tests whether other features of the state modify the dependency. At endogenous loci, crossing sequence edits with regulator interventions would test whether a gene’s response to the intervention depends on the edited regulatory sequence.
Sampling a range of regulator activity can expose sequence features whose contributions are weak under baseline conditions. In cranial neural crest cells, models fine-tuned on accessibility responses to TF dosage identified low-affinity TWIST1 motifs associated with dosage sensitivity despite weak contributions to predicted accessibility in unperturbed cells. Reporter assays supported their role in increasing sensitivity to changes in TWIST1 dosage169. Interpreting differences in sensitivity across cellular contexts requires measuring the achieved change in regulator abundance or activity and recording when the molecular measurements were collected after intervention. Otherwise, unequal perturbation strengths or sampling times can appear as differences in regulatory sensitivity.
Varying binding-site affinity or TF dosage characterizes a particular sequence–regulator dependency over a broader range. Distinguishing the contributions of correlated regulatory components requires comparisons that vary those components separately. Perturbing coexpressed TFs individually and disrupting motifs that frequently co-occur can help distinguish contributions that remain unresolved in observational measurements170. Combined perturbations then test how those contributions change when other components are altered, including cases where joint perturbations produce substantial responses despite little effect from the individual interventions171.
Evaluating regulatory effects
Predicting regulatory changes
Regulatory-effect evaluation compares predicted and measured changes at the same genes or loci across conditions. Scores pooled across genes or loci can be dominated by their persistent differences in baseline activity, even when changes across conditions are poorly predicted. In PanExonNet benchmarks, models with high overall exon-inclusion accuracy differed substantially in predicting deviations from each exon’s median inclusion across training samples159. Predicting each gene or locus’s average activity across training contexts establishes how much performance is explained by this stable component. Reusing the profile of the training context most similar in the supplied cellular measurements tests whether the model improves on a similar observed state172. Reporting performance at differentially active loci alongside results across all loci then exposes errors specifically in context-dependent changes114.
In the crossed motif-edit and TF-dosage experiment, the interaction contrast is the change in the edit’s effect between dosages. Sequence-only and context-only models indicate how well either input predicts activity. A model that sums separate sequence and context contributions predicts a constant edit effect on the scale where they are added. Comparing the measured contrast with predictions from the joint and additive models tests whether joint modeling improves prediction of dosage-dependent edit effects. The edit effects at each dosage and the dosage effects for each sequence should also be evaluated because errors in those effects can cancel in the contrast.
Interpreting this contrast as regulatory cooperation requires specifying the response scale, such as linear or log-transformed expression. Saturation can make a combined increase in measured activity smaller than the sum of the individual increases, even when the underlying contributions are additive173. A baseline fitted to training data can test how much of the measured interaction is explained by a shared nonlinear mapping from summed contributions to the readout. Dose series help constrain the shape of that response function.
For transcriptome-wide responses, predicting which genes respond to an intervention and estimating the magnitude of their expression changes are distinct tasks. Correlation across genes can remain high when effect sizes are systematically underestimated. Comparing predicted and experimentally identified responders across all evaluated genes tests which responses the model detects or misses. Reporting effect-size errors among measured responders then exposes errors otherwise obscured by agreement on unchanged expression174. Even among responding genes, different interventions can elicit similar changes. Predicting the mean change from controls across training interventions in a comparable cell population tests how much of the response can be predicted without distinguishing the interventions72.
Measured responses provide an empirical check on the metric itself. The mean expression change from matched controls in one group of perturbed cells can serve as a prediction for another group exposed to the same intervention73. Comparing its score with that of a different intervention’s response tests whether the metric rewards intervention-specific information. These controls use observed responses and should be reported separately from training-derived baselines. Splitting cells from one sample measures within-sample consistency, while comparisons across independent biological replicates measure reproducibility175.
A population-level response includes changes in expression within cellular states and changes in the proportions of those states. The mean expression profile reflects both contributions, allowing errors in one to compensate for errors in the other. Where corresponding states can be identified, evaluating within-state expression distributions separately from state proportions distinguishes these sources of the response168. This assessment must also retain states that appear or disappear after intervention, even when their absence from one condition prevents a within-state expression comparison.
Generalization and adaptation
Holding out a sequence–state combination while observing both the sequence and the state elsewhere in training tests whether a model can predict a new combination of familiar inputs. Withholding entire loci, regulator interventions, donors, or cellular states tests transfer along each of those axes176. For genomic holdouts, evaluation should distinguish exposure to test sequences during pretraining from access to their molecular readouts during training or through cellular inputs. For example, scooby excludes genes and accessibility peaks overlapping validation and test regions before constructing its cell embeddings12. Using measurements from a new locus to fit enhancer–gene weights, or from a new study to fine-tune a model, evaluates adaptation. When predictions are available before adaptation, comparing the original and adapted models on the same independent test samples measures the gain from those additional data.
The degree of extrapolation can vary substantially among holdouts of the same kind. A held-out cell type may closely resemble training cell types in regulator expression or combine familiar regulator levels in a previously unobserved pattern. Along a developmental trajectory, withholding an intermediate stage while retaining earlier and later stages can test interpolation. Forecasting beyond the observed time range tests temporal extrapolation, while a held-out lineage may share early states with training lineages and diverge later. RNA measured at a held-out stage can supply context for predicting accessibility at that stage. Forecasting how cells reach that state after an intervention requires the starting measurements and the specified intervention.
Genomic holdouts also span different degrees of distribution shift. Donor haplotypes can carry single-nucleotide substitutions and structural variants whose frequencies differ among populations, while transfer across species can involve broader changes in sequence composition and motif organization. Shifts in the distribution of sequence or cellular inputs constitute covariate shift when the relationship between those inputs and regulatory activity remains stable177. Concept shift occurs when the distribution of activity changes at the same sequence and measured cellular context. For example, stimulation can alter TF activity and target-gene transcription at unchanged regulator RNA levels.
Across studies, differences in cell-type proportions can change aggregate prediction scores even when accuracy within each type remains stable. For cell-type classification, this constitutes label shift if the distribution of measured profiles within each type is preserved178. For expression and accessibility prediction, assay protocols can also change the scale or variability of the readout under matched biological conditions165. A shift in signal scale can bias predicted effect sizes, while greater measurement noise can reduce agreement even when mean predictions remain accurate. Shared samples profiled across studies help distinguish these measurement effects from biological differences. Within and across studies, reporting regulatory-effect errors by variant class, regulator dosage relative to the training range, and similarity to profiled cellular states can reveal where predictions deteriorate under shifts relevant to the intended application. For models reporting prediction intervals, coverage and width within each group can expose overconfidence in unfamiliar states that aggregate coverage would obscure179,180.
Interpreting regulatory relationships across sequence and cellular state
Model interpretation aims to characterize the relationships learned by a predictive model and use them to formulate testable hypotheses about biological regulation. Ante hoc approaches encourage interpretable representations through model design, including architectures designed to represent sequence motifs or gene modules181–186. Here, we focus on post hoc approaches that nominate regulatory features, test their necessity and sufficiency within the model, and quantify their interactions. For joint models, these approaches can examine which sequence sites and cellular inputs explain why a predicted sequence effect changes across states.
Attribution analysis assigns scores to input features, such as nucleotides or regulator expression values, to describe their influence on a selected model output. Gradient saliency measures local sensitivity to input changes187, while DeepLIFT, DeepSHAP, and integrated gradients estimate contributions relative to a reference input or background distribution188–190. The reference specifies the inputs used for comparison, such as shuffled DNA sequences or control expression profiles. Attributing a cellular embedding identifies gene inputs that shape the learned representation191, while attributing a predicted expression difference from a matched control identifies inputs contributing to the modeled response.
For DNA inputs, nucleotide attributions localize candidate regulatory sites. In sequence-to-profile models, PISA resolves attributions across output positions, showing where along the predicted profile an input feature contributes192. Comparing nucleotide attribution patterns across loci can identify recurring motifs. TF-MoDISco identifies short sequence segments with strong attribution signals, termed seqlets, and aligns and clusters their attribution patterns to discover motifs193. TF-MInDi represents seqlets through their similarities to a reference motif collection, clusters them in that representation, and constructs consensus motifs from the resulting groups194.
Controlled in silico experiments test how a prediction or learned representation responds to changes in its inputs. In Geneformer, deleting a gene token or raising its rank in the encoded expression profile tests how cell or gene embeddings depend on that gene60. In seq2func models, disrupting or introducing a candidate site can test whether it is necessary or sufficient for predicted activity in a specified sequence background. A motif knockout tests necessity by disrupting the site in its original context and measuring the change in predicted expression, accessibility, or TF binding while holding cellular inputs fixed. Single-nucleotide mutagenesis resolves which substitutions disrupt or preserve the site’s contribution.
Motif knock-ins test sufficiency by asking whether introducing the site into another background can confer the predicted activity or response of interest. Because the receiving sequence may supply different supporting or competing features, an implantation effect is specific to that background. Global importance analysis (GIA) extends this test across a chosen background distribution, averaging prediction differences between matched sequences with and without the implanted feature80. Varying motif identity, copy number, or flanking sequence can then reveal which properties account for differences in the response. This distinguishes contributions associated with the core motif from those that require a particular local sequence context. DeepSTARR analyses and reporter assays examined this distinction by exchanging flanks between weak and strong GATA motif instances, finding that the exchanges could alter enhancer activity while retaining the core motif86.
Mutations around a reference sequence can reveal how disrupting one site changes the contributions of others. Second-order in silico mutagenesis measures these dependencies through departures of double-mutant effects from the sum of individual effects on the chosen output scale. DFIM measures how perturbing a nucleotide or motif changes attribution to other sites, identifying changes in their contributions to the prediction195. SEAM extends this comparison to whole attribution maps across variants, grouping similar patterns and relating them to sequence changes196. These groups can reveal alternative motif configurations or increased contributions from weak or cryptic sites, including cases where changes in feature use produce little change in predicted activity. SQUID summarizes predictions across a local variant library with an interpretable surrogate, a simpler model fitted to the original predictor’s outputs to estimate nucleotide contributions and optional pairwise interactions197. A nonlinear mapping from the fitted sequence contributions to the predicted readout can account for saturation separately from nucleotide-specific interaction terms198.
Designed combinations of motif or element perturbations can then test specific hypotheses about cooperation and compensation. Implanting two motifs individually and together asks whether their joint effect can be explained by their separate contributions, while varying their spacing tests whether the dependency requires a particular arrangement. BPNet analyses used such comparisons to quantify how one motif altered predicted TF binding at another across different spacings81. At the scale of regulatory elements, compensation can conceal a region’s contribution when another element remains intact. CREME searches for influential combinations through systematic perturbations of sequence tiles, contiguous segments of the input DNA82. Shuffling tiles in their genomic context tests necessity, while retaining selected tiles and the promoter at their original positions in shuffled backgrounds tests sufficiency. Comparing individual tile effects with the effects of combinations selected by the search can reveal contributions masked by compensation or nominate cooperative relationships within the model.
In joint models, attribution methods and in silico perturbations can examine how cellular inputs modify the predicted effect of a sequence variant. Comparing sequence attributions for the same DNA across states, using the same attribution baseline, can nominate sites whose contributions vary with context. Attributing the predicted variant–reference difference to cellular inputs can then nominate contextual features for testing. When TF expression is an explicit input, changing its value and recomputing the allele difference tests whether the predicted variant effect depends on the supplied TF transcript abundance.
Disrupting an additional candidate binding site in both allelic backgrounds and repeating the regulator-input comparison tests whether that site contributes to the predicted dependence of the variant effect on regulator expression. Related TFs and alternative site disruptions provide specificity tests when regulators are coexpressed or recognize similar motifs. Comparing predicted variant effects across measured cell profiles can also identify cellular backgrounds for experimental testing. Searches over unmeasured context inputs could extend these comparisons187,199, although optimization can favor states in which prediction errors exaggerate the variant effect200,201. Prioritizing biologically plausible states and assessing uncertainty in those contexts could guide experiments that cross the nominated sequence edits with perturbations of regulator abundance or activity.
Discussion and outlook
A near-term priority is to test whether joint models predict sequence effects across regulator perturbations and regulator responses across sequence backgrounds. Coupling these models over time could extend prediction to the propagation and persistence of regulatory responses. Repeated scaling pilots could guide investment toward measurements that improve the targeted predictions, while agentic loops could use evaluation and interpretation to refine model designs and propose subsequent experiments.
Coupling sequence and cell state predictions over time
Explaining how cells develop and respond to perturbations requires identifying how early regulatory changes produce later cellular states. The order and timing of molecular events help distinguish regulatory pathways that lead to similar endpoint expression profiles. A variant that increases TF protein abundance may alter transcription at the TF’s target genes according to their regulatory sequences, including genes encoding regulators that reinforce or oppose the initial response. Changes in TF activity can also alter chromatin accessibility and thereby modify subsequent transcription34,35. Coupling sequence and cell state models over time could represent these dependencies explicitly, generating causal hypotheses that temporal measurements and timed perturbations could help distinguish.
Single-cell measurements collected at multiple time points provide snapshots of changing cell populations, supporting reconstruction of developmental trajectories and forward simulation of cellular responses202,203. Changes in state abundance can reflect transitions between states or differences in proliferation and cell death, which models of population responses need to account for202. Models of RNA and chromatin kinetics further constrain how molecular states change204,205. Incorporating regulatory interactions into RNA production, splicing, and degradation dynamics supports simulations of regulator perturbations206, while jointly modeling gene expression and motif-associated accessibility connects RNA dynamics to chromatin changes207. Coupling these formulations to sequence-dependent predictions could specify how an edit alters transcription or accessibility as the regulatory environment evolves.
A first step would couple sequence and cell state models through repeated updates (Figure 4). A context-aware seq2func component would predict locus-specific molecular readouts from DNA and the current cellular context. A dynamical component would estimate changes in molecular abundance and regulator activity over each interval from the current state, molecular readouts, and specified intervention. The first update would use readouts measured at t0. Subsequent updates would use readouts predicted from DNA and the evolving cellular state. Predicted RNA abundance or accessibility could serve as inputs to a learned state update. A kinetic model would require estimates of rates such as transcription and RNA degradation, together with a model linking those rates to the measured assay signals. The updated state would condition the next sequence prediction, so subsequent transcription would depend on the consequences of earlier regulation. An enhancer edit would remain in the sequence throughout the simulation, while a transient regulator perturbation would be imposed according to its experimental schedule. Errors in molecular abundance, activity, or timing could consequently affect later steps in the simulation.
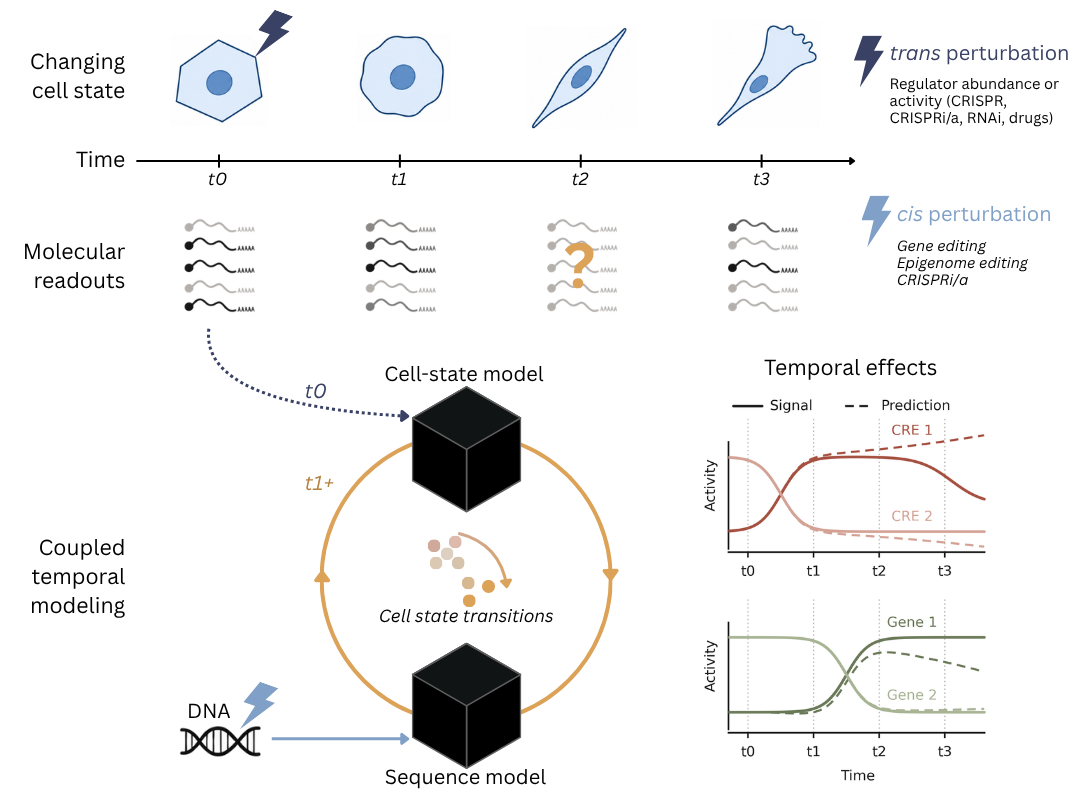
Time-resolved perturbation measurements could constrain the intermediate states and transition times predicted by the coupled model. Connecting transcription to subsequent regulator abundance requires accounting for RNA processing and degradation, translation, and protein turnover208,209. Paired RNA and protein measurements across differentiating cells have revealed RNA changes that precede protein changes along inferred trajectories126. Regulator activity can also change independently of abundance. If similar measured profiles lead to different responses because of prior stimulation, the dynamical state may need to retain information about that history127. Measurements of RNA, chromatin accessibility, and selected regulator proteins or activities throughout a response could help the model learn how these processes shape subsequent transcription.
Destructive molecular assays sample different cells at successive times, leaving the connections between measured states to be inferred. Lineage tracing can constrain relationships between earlier and later cell populations44, while linking transcriptomic snapshots to live-cell imaging can provide information about how individual cells reached those states210. Live-cell imaging could follow individual cells through a perturbation response, while transcriptomic profiling of selected cells at defined times would link their expression states to preceding behavior and reporter dynamics211. A model trained on these paired imaging histories and transcriptomes could estimate expression changes along the tracked trajectories, providing temporal information between molecular sampling times. Measured transcriptomes would constrain the trajectories at sampled times, while predictions at times withheld from training could be compared with the corresponding transcriptomes to assess which genes or expression programs are recoverable from imaging. Errors on these held-out measurements could help calibrate uncertainty in the inferred expression states, including cases where similar imaging histories accompany different molecular profiles. The inferred trajectories could then provide additional constraints on the coupled model’s state updates, with less certain estimates receiving less weight during training.
Coupled models could help identify intervention schedules that drive cells toward a desired state that persists after withdrawal. Reprogramming with the Yamanaka factors illustrates why timing matters, as the order and duration of factor expression can influence the transition to pluripotency212,213. A coupled model could predict how early changes in chromatin accessibility and endogenous regulator activity alter the response to later interventions. Comparing predicted trajectories under alternative schedules could then help prioritize when to introduce or withdraw individual factors and identify intermediate regulatory changes that distinguish successful transitions from stalled or alternative responses.
Evaluation would begin each predicted trajectory from the measured starting state and specified intervention schedule, with subsequent updates conditioned on the model’s own predicted context. Comparisons with independent time-resolved measurements would assess the order, timing, and magnitude of molecular responses and whether the target state is reached and maintained. Inhibiting an intermediate regulator before a transition and after the new state is established could test its roles in initiation and maintenance. Withdrawal of the initiating stimulus, combined with perturbation of regulators predicted to sustain the response, could test whether the proposed feedback explains persistence or reversal of the cellular state.
Data scaling and continual refinement
Scaling joint sequence–cell state models requires choosing which additional measurements will improve prediction of sequence effects and regulator responses across cellular contexts. Collecting more examples within one cellular context can refine the sequence–activity relationships learned there, while comparisons across contexts provide evidence for how those relationships change with the regulatory environment. Within one cell type, testing regulatory sites individually and in combination can reveal how the effect of disrupting one site changes when another is disrupted. Repeating selected edits across TF dosages can then show how those sequence effects vary with regulator availability. These strategies compete for experimental resources, and extending measurements to additional tissues or species introduces further costs and differences in biological coverage. Pilot scaling studies could compare how these experimental strategies improve prediction of sequence effects and regulator responses relative to their costs, providing evidence for which investments to expand.
Each pilot would train models on the existing data mixture alone and with progressively larger subsets of each candidate collection. At each data scale, the pilot would explore a range of architectures, representations, and training objectives for each collection, using common validation tasks and recording the computational costs of model selection and training. For each modeling approach, gains from the added data would be evaluated separately on held-out tasks such as predicting variant effects across cellular states and regulator responses across sequence backgrounds. This would show whether a collection improves both capabilities or primarily benefits one task under particular training objectives. For example, perturbation profiles may yield larger gains in response prediction when training gives explicit weight to expression changes from matched controls.
Pilot studies could also vary the proportions of different collections at matched experimental budgets or compare policies for selecting measurements within a collection. Active-learning policies use criteria such as uncertainty or diversity to select the next measurements as the model is updated214,215, with applications to regulatory sequence and perturbation-response prediction216,217. Comparing the resulting performance curves alongside data-generation and training costs could guide which collections or mixtures to expand and, where extrapolation is supported, estimate the investment needed to reach a performance target218.
Monitoring gains as collections grow would help identify when to repeat the pilots. Broad measurements across cell types may initially reveal sequence features shared across contexts. Once these features are well characterized, testing the same motif edits across TF dosages may better resolve differences in regulatory sensitivity. If assay noise obscures the remaining effects, greater measurement precision may be more valuable than broader coverage. Diminishing returns from observational pretraining in some transcriptomic models and tasks64 motivate comparing these alternatives as the model and its training objective change.
Successive rounds may produce small, targeted studies that address errors left by much larger training collections. Abundant assays can dominate joint training, while updating a genome-wide model on perturbations at a few loci risks degrading predictions elsewhere through catastrophic forgetting219. Continual learning could reduce the cost of retraining after each round5,220. Evaluating gains on the targeted perturbations alongside performance at previously modeled loci and cellular states would test whether an update incorporates the new evidence while retaining earlier capabilities.
Agentic discovery and refinement of regulatory models
Agents based on large language models (LLMs) could use biological knowledge and results from previous tests to propose and refine regulatory models, explanations of model behavior, or experimental designs. FunSearch and AlphaEvolve illustrate how LLM-generated programs can be improved through automated evaluation and evolutionary search, which repeatedly generates variants of candidate programs and selects them according to their evaluation scores221,222. In regulatory modeling, feedback could come from predictive performance on a validation set of perturbation measurements or from whether a proposed explanation accounts for a trained model’s responses to controlled input changes. An agentic loop would use this feedback to revise proposals and select subsequent tests. Experimental-design loops would receive feedback as new measurements become available, with assay cost and duration shaping the rate of iteration.
For model optimization, agents could explore alternative architectures and training procedures through an evolutionary search over candidate models221,223. Each round would train and evaluate candidates against a fixed objective that measures the intended regulatory capabilities, such as predicting changes in variant effects across cellular states or responses to regulator perturbations. The search could vary where cellular context enters sequence processing, which transformations preserve information about regulator activity, or how locus-specific predictions contribute to a cellular response. A candidate model could connect predicted changes in regulator expression to transcription at downstream loci, testing whether explicitly representing regulatory cascades improves response prediction. Evaluation procedures would remain outside the agents’ control, with reserved tests assessing whether improvements extend beyond the evaluations used during search.
For model interpretation, agents could use attribution and perturbation results to formulate hypotheses about how sequence features and cellular inputs jointly affect predictions, then select in silico experiments that distinguish competing explanations. Changing a regulator input before and after disrupting a candidate binding site, for example, could test whether the model’s response to that input depends on the site. These comparisons would refine explanations of the trained model’s behavior without requiring new biological measurements. Prediction failures and the resulting regulatory hypotheses could then guide proposals for experiments in cells, with feasibility and cost shaping which sequences, regulators, and cellular contexts are tested. The pilot-scaling framework could compare these proposed collections with established acquisition strategies by measuring improvements in sequence-effect and regulator-response prediction at matched experimental and computational budgets.
Glossary terms
- cis-regulatory element: is a DNA sequence that regulates transcription of a target gene on the same DNA molecule
- trans-acting factor: is a diffusible regulatory molecule, such as a protein or RNA, whose action does not require physical linkage between its encoding gene and its target gene
- chromatin state: is the molecular and structural properties of chromatin, including nucleosome organization, accessibility, histone modifications, DNA methylation and three-dimensional organization
- cell state: is the molecular and physiological condition of a cell at a given time, including its chromatin state and the abundance and activity of regulatory molecules
- learned representation: a numerical encoding of an input, such as a cellular profile, whose features are learned from data and used for comparisons or predictions
- pretraining: an initial training stage that learns model parameters or representations for reuse in subsequent tasks, either directly or after fine-tuning
- foundation model: a model pretrained on a broad data collection with the aim of supporting multiple tasks through its learned representations or further adaptation
- single-task seq2func model: a sequence-to-function model trained to predict a particular molecular readout in a specified cellular context
- multi-task seq2func model: a sequence-to-function model that shares learned sequence representations to predict multiple molecular readouts or the same readout across cellular contexts
- feature leakage: in a multi-task model, transfer of a learned feature association across outputs that produces misleading regulatory dependencies
- fusion: the integration of sequence and cellular context through joint processing of representations, modulation of features, or generation of context-dependent model parameters. The fusion stage specifies where context acts, and the fusion operation specifies how.
- metacell: an aggregate molecular profile constructed from a small group of cells with similar measured profiles to reduce sparsity
- pseudobulk: an aggregate profile typically constructed by summing counts across cells of a defined population within each biological sample, such as one cell type from one donor
- covariate shift: a change in the distribution of model inputs while the conditional relationship between inputs and prediction targets remains stable
- concept shift: a change in the conditional relationship between model inputs and prediction targets, potentially reflecting an unmeasured regulatory variable or a change in measurement
- label shift: a change in target class prevalence while the distribution of inputs within each class remains stable
- attribution method: a method that assigns scores to input features to describe their contributions to a selected model output or the output’s sensitivity to changes in those features
- in silico experiment: a controlled comparison of model predictions under specified input changes, used to test hypotheses about feature contributions and interactions within the model
- agentic loop: an iterative process in which an AI agent selects actions toward a specified objective and uses feedback from their execution to guide subsequent actions
Competing interests
P.K.K. is a paid consultant for Inari Agriculture, serves on the scientific advisory board of Collage Bio, and holds stock options in both companies. A.K. is on the scientific advisory boards of SerImmune, TensorBio and AINovo; is a consultant with Arcardia Science, Inari, Precede Biosciences and Bristol Myers Squibb; was a consultant with Illumina and PatchBio; and has a financial stake in DeepGenomics, SerImmune, Immunai and Freenome. The remaining authors declare no competing interests.
References
- Kim, S. & Wysocka, J. Deciphering the multi-scale, quantitative cis-regulatory code. Mol. Cell 83, 373–392, DOI: 10.1016/j.molcel.2022.12.032 (2023).
- Gertz, J. & Cohen, B. A. Environment-specific combinatorial cis-regulation in synthetic promoters. Mol. Syst. Biol. 5, 244, DOI: 10.1038/msb.2009.1 (2009).
- Yosef, N. et al. Dynamic regulatory network controlling TH17 cell differentiation. Nature 496, 461–468, DOI: 10.1038/nature11981 (2013).
- Barbadilla-Martínez, L., Klaassen, N., van Steensel, B. & de Ridder, J. Predicting gene expression from DNA sequence using deep learning models. Nat. Rev. Genet. 26, 666–680, DOI: 10.1038/s41576-025-00841-2 (2025).
- Nagai, M., Murphy, A. E., Rizzo, K. & Koo, P. K. Toward generalizable and interpretable AI in regulatory genomics. Nat. Genet. 58, 1787–1802, DOI: 10.1038/s41588-026-02670-3 (2026).
- Sokolova, K., Chen, K. M., Hao, Y., Zhou, J. & Troyanskaya, O. G. Deep learning sequence models for transcriptional regulation. Annu. Rev. Genomics Hum. Genet. 25, 105–122, DOI: 10.1146/annurev-genom-021623-024727 (2024).
- De Winter, S., Konstantakos, V. & Aerts, S. Modelling and design of transcriptional enhancers. Nat. Rev. Bioeng. 3, 374–389 (2025).
- Novakovsky, G., Dexter, N., Libbrecht, M. W., Wasserman, W. W. & Mostafavi, S. Obtaining genetics insights from deep learning via explainable artificial intelligence. Nat. Rev. Genet. 24, 125–137, DOI: 10.1038/s41576-022-00532-2 (2023).
- Ahlmann-Eltze, C., Barkmann, F., Lause, J., Boeva, V. & Kobak, D. Representation learning of single-cell RNA-seq data. RNA 32, 504–519, DOI: 10.1261/rna.080889.125 (2026).
- Dimitrov, D., Schrod, S., Rohbeck, M. & Stegle, O. Interpretation, extrapolation and perturbation of single cells. Nat. Rev. Genet. 27, 349–370, DOI: 10.1038/s41576-025-00920-4 (2026).
- Wei, J., Xue, Y., Chai, H. & Gao, Y. Q. GenoME: a MoE-based generative model for individualized, multimodal prediction and perturbation of genomic profiles. Nucleic Acids Res. 54, gkag902, DOI: 10.1093/nar/gkag902 (2026).
- Hingerl, J. C. et al. scooby: modeling multimodal genomic profiles from DNA sequence at single-cell resolution. Nat. Methods 22, 2275–2285, DOI: 10.1038/s41592-025-02854-5 (2025).
- Aksu, E. D. & Vingron, M. Context-aware sequence-to-function model of human gene regulation. Nat. Commun. 17, 6200, DOI: 10.1038/s41467-026-75527-2 (2026).
- Bravo González-Blas, C. et al. SCENIC+: single-cell multiomic inference of enhancers and gene regulatory networks. Nat. Methods 20, 1355–1367, DOI: 10.1038/s41592-023-01938-4 (2023).
- Kamal, A. et al. GRaNIE and GRaNPA: inference and evaluation of enhancer-mediated gene regulatory networks. Mol. Syst. Biol. 19, e11627, DOI: 10.15252/msb.202311627 (2023).
- Partel, G., De Winter, S., Konstantakos, V., Blaauw, C. H. & Aerts, S. DeepSCENIC: transfer learning from sequence-to-function models enables causal gene regulatory network inference. bioRxiv DOI: 10.64898/2026.09.18.752607 (2026). https://www.biorxiv.org/content/early/2026/09/22/2026.09.18.752607.full.pdf.
- Probst, A. V., Dunleavy, E. & Almouzni, G. Epigenetic inheritance during the cell cycle. Nat. Rev. Mol. Cell Biol. 10, 192–206, DOI: 10.1038/nrm2640 (2009).
- Statello, L., Guo, C.-J., Chen, L.-L. & Huarte, M. Gene regulation by long non-coding RNAs and its biological functions. Nat. Rev. Mol. Cell Biol. 22, 96–118, DOI: 10.1038/s41580-020-00315-9 (2021).
- Naqvi, S. et al. Precise modulation of transcription factor levels identifies features underlying dosage sensitivity. Nat. Genet. 55, 841–851, DOI: 10.1038/s41588-023-01366-2 (2023).
- Glasmacher, E. et al. A genomic regulatory element that directs assembly and function of immune-specific AP-1-IRF complexes. Science 338, 975–980, DOI: 10.1126/science.1228309 (2012).
- Jantz, D. & Berg, J. M. Reduction in DNA-binding affinity of Cys2His2 zinc finger proteins by linker phosphorylation. Proc. Natl. Acad. Sci. United States Am. 101, 7589–7593, DOI: 10.1073/pnas.0402191101 (2004).
- Vandromme, M., Gauthier-Rouvière, C., Lamb, N. & Fernandez, A. Regulation of transcription factor localization: fine-tuning of gene expression. Trends Biochem. Sci. 21, 59–64, DOI: 10.1016/s0968-0004(96)80182-4 (1996).
- Hoffmann, A., Levchenko, A., Scott, M. L. & Baltimore, D. The IκB–NF-κB signaling module: temporal control and selective gene activation. Science 298, 1241–1245, DOI: 10.1126/science.1071914 (2002).
- Dupont, S. et al. Role of YAP/TAZ in mechanotransduction. Nature 474, 179–183, DOI: 10.1038/nature10137 (2011).
- Kawaguchi, T., Takenoshita, M., Kabashima, T. & Uyeda, K. Glucose and cAMP regulate the L-type pyruvate kinase gene by phosphorylation/dephosphorylation of the carbohydrate response element binding protein. Proc. Natl. Acad. Sci. United States Am. 98, 13710–13715, DOI: 10.1073/pnas.231370798 (2001).
- Jolma, A. et al. DNA-binding specificities of human transcription factors. Cell 152, 327–339, DOI: 10.1016/j.cell.2012.12.009 (2013).
- Ghoshdastidar, D. & Bansal, M. Flexibility of flanking DNA is a key determinant of transcription factor affinity for the core motif. Biophys. J. 121, 3987–4000, DOI: 10.1016/j.bpj.2022.08.015 (2022).
- Horton, C. A. et al. Short tandem repeats bind transcription factors to tune eukaryotic gene expression. Science 381, eadd1250, DOI: 10.1126/science.add1250 (2023).
- Xie, Z. et al. DNA-guided transcription factor interactions extend human gene regulatory code. Nature 641, 1329–1338, DOI: 10.1038/s41586-025-08844-z (2025).
- Kim, S. et al. DNA-guided transcription factor cooperativity shapes face and limb mesenchyme. Cell 187, 692–711.e26, DOI: 10.1016/j.cell.2023.12.032 (2024).
- The ENCODE Project Consortium et al. Expanded encyclopaedias of DNA elements in the human and mouse genomes. Nature 583, 699–710, DOI: 10.1038/s41586-020-2493-4 (2020).
- Zhu, F. et al. The interaction landscape between transcription factors and the nucleosome. Nature 562, 76–81, DOI: 10.1038/s41586-018-0549-5 (2018).
- Yin, Y. et al. Impact of cytosine methylation on DNA binding specificities of human transcription factors. Science 356, eaaj2239, DOI: 10.1126/science.aaj2239 (2017).
- Klemm, S. L., Shipony, Z. & Greenleaf, W. J. Chromatin accessibility and the regulatory epigenome. Nat. Rev. Genet. 20, 207–220, DOI: 10.1038/s41576-018-0089-8 (2019).
- Barral, A. & Zaret, K. S. Pioneer factors: roles and their regulation in development. Trends Genet. 40, 134–148, DOI: 10.1016/j.tig.2023.10.007 (2024).
- Lupiáñez, D. G. et al. Disruptions of topological chromatin domains cause pathogenic rewiring of gene-enhancer interactions. Cell 161, 1012–1025, DOI: 10.1016/j.cell.2015.04.004 (2015).
- Small, K. S. et al. Regulatory variants at KLF14 influence type 2 diabetes risk via a female-specific effect on adipocyte size and body composition. Nat. Genet. 50, 572–580, DOI: 10.1038/s41588-018-0088-x (2018).
- Preger-Ben Noon, E. et al. Comprehensive analysis of a cis-regulatory region reveals pleiotropy in enhancer function. Cell Reports 22, 3021–3031, DOI: 10.1016/j.celrep.2018.02.073 (2018).
- Wittkopp, P. J., Haerum, B. K. & Clark, A. G. Evolutionary changes in cis and trans gene regulation. Nature 430, 85–88, DOI: 10.1038/nature02698 (2004).
- Wong, E. S. et al. Interplay of cis and trans mechanisms driving transcription factor binding and gene expression evolution. Nat. Commun. 8, 1092, DOI: 10.1038/s41467-017-01037-x (2017).
- Schwalb, B. et al. TT-seq maps the human transient transcriptome. Science 352, 1225–1228, DOI: 10.1126/science.aad9841 (2016).
- Jiménez, A. et al. Time-series transcriptomics and proteomics reveal alternative modes to decode p53 oscillations. Mol. Syst. Biol. 18, e10588, DOI: 10.15252/msb.202110588 (2022).
- Dixit, A. et al. Perturb-seq: dissecting molecular circuits with scalable single-cell RNA profiling of pooled genetic screens. Cell 167, 1853–1866.e17, DOI: 10.1016/j.cell.2016.11.038 (2016).
- Weinreb, C., Rodriguez-Fraticelli, A., Camargo, F. D. & Klein, A. M. Lineage tracing on transcriptional landscapes links state to fate during differentiation. Science 367, eaaw3381, DOI: 10.1126/science.aaw3381 (2020).
- Xu, C. et al. Probabilistic harmonization and annotation of single-cell transcriptomics data with deep generative models. Mol. Syst. Biol. 17, MSB20209620 (2021).
- Brbić, M. et al. MARS: discovering novel cell types across heterogeneous single-cell experiments. Nat. Methods 17, 1200–1206 (2020).
- Lopez, R., Regier, J., Cole, M. B., Jordan, M. I. & Yosef, N. Deep generative modeling for single-cell transcriptomics. Nat. Methods 15, 1053–1058, DOI: 10.1038/s41592-018-0229-2 (2018).
- Lotfollahi, M. et al. Mapping single-cell data to reference atlases by transfer learning. Nat. Biotechnol. 40, 121–130, DOI: 10.1038/s41587-021-01001-7 (2022).
- Van Dijk, D. et al. Recovering gene interactions from single-cell data using data diffusion. Cell 174, 716–729 (2018).
- Huang, M. et al. SAVER: gene expression recovery for single-cell RNA sequencing. Nat. Methods 15, 539–542 (2018).
- Lotfollahi, M., Wolf, F. A. & Theis, F. J. scGen predicts single-cell perturbation responses. Nat. Methods 16, 715–721 (2019).
- Roohani, Y., Huang, K. & Leskovec, J. Predicting transcriptional outcomes of novel multigene perturbations with GEARS. Nat. Biotechnol. 42, 927–935, DOI: 10.1038/s41587-023-01905-6 (2024).
- Jiang, S. et al. The landscape of single-cell foundation models: Design principles, applications, and open challenges. Preprints DOI: 10.20944/preprints202608.1166.v1 (2026).
- Cui, H. et al. Towards multimodal foundation models in molecular cell biology. Nature 640, 623–633, DOI: 10.1038/s41586-025-08710-y (2025).
- Bahrami, M., Tejada-Lapuerta, A., Becker, S., Hashemi G, F. S. & Theis, F. J. scConcept: Contrastive pretraining for technology-agnostic single-cell representations beyond reconstruction. bioRxiv 2025–10 (2025).
- Rosen, Y. et al. Universal cell embedding provides a foundation model for cell biology. Nature 656, 183–191, DOI: 10.1038/s41586-026-10689-z (2026).
- Pearce, J. D. et al. TranscriptFormer: A generative cell atlas across 1.5 billion years of evolution. Science 393, aec8514, DOI: 10.1126/science.aec8514 (2026).
- Rosen, Y. et al. Toward universal cell embeddings: integrating single-cell RNA-seq datasets across species with SATURN. Nat. Methods 21, 1492–1500, DOI: 10.1038/s41592-024-02191-z (2024).
- Heimberg, G. et al. A cell atlas foundation model for scalable search of similar human cells. Nature 638, 1085–1094, DOI: 10.1038/s41586-024-08411-y (2025).
- Theodoris, C. V. et al. Transfer learning enables predictions in network biology. Nature 618, 616–624, DOI: 10.1038/s41586-023-06139-9 (2023).
- Cui, H. et al. scGPT: toward building a foundation model for single-cell multi-omics using generative AI. Nat. Methods 21, 1470–1480, DOI: 10.1038/s41592-024-02201-0 (2024).
- Richter, T., Bahrami, M., Xia, Y., Fischer, D. S. & Theis, F. J. Delineating the effective use of self-supervised learning in single-cell genomics. Nat. Mach. Intell. 7, 68–78, DOI: 10.1038/s42256-024-00934-3 (2025).
- Kedzierska, K. Z., Crawford, L., Amini, A. P. & Lu, A. X. Zero-shot evaluation reveals limitations of single-cell foundation models. Genome Biol. 26, 101, DOI: 10.1186/s13059-025-03574-x (2025).
- DenAdel, A. et al. Evaluating the role of pretraining dataset size and diversity on single-cell foundation model performance. Nat. Methods 23, 1447–1457, DOI: 10.1038/s41592-026-03120-y (2026).
- Cao, J. et al. Joint profiling of chromatin accessibility and gene expression in thousands of single cells. Science 361, 1380–1385, DOI: 10.1126/science.aau0730 (2018).
- Ashuach, T. et al. MultiVI: deep generative model for the integration of multimodal data. Nat. Methods 20, 1222–1231, DOI: 10.1038/s41592-023-01909-9 (2023).
- Chen, X. et al. EpiAgent: foundation model for single-cell epigenomics. Nat. Methods 22, 2316–2327, DOI: 10.1038/s41592-025-02822-z (2025).
- Lotfollahi, M. et al. Predicting cellular responses to complex perturbations in high-throughput screens. Mol. Syst. Biol. 19, e11517, DOI: 10.15252/msb.202211517 (2023).
- Ashburner, M. et al. Gene Ontology: tool for the unification of biology. Nat. Genet. 25, 25–29, DOI: 10.1038/75556 (2000).
- Hasanaj, E. et al. Multimodal benchmarking of foundation model representations for cellular perturbation response prediction. bioRxiv 2025.06.26.661186, DOI: 10.1101/2025.06.26.661186 (2025).
- Ahlmann-Eltze, C., Huber, W. & Anders, S. Deep-learning-based gene perturbation effect prediction does not yet outperform simple linear baselines. Nat. Methods 22, 1657–1661, DOI: 10.1038/s41592-025-02772-6 (2025).
- Viñas Torné, R. et al. Systema: a framework for evaluating genetic perturbation response prediction beyond systematic variation. Nat. Biotechnol. 44, 1050–1059, DOI: 10.1038/s41587-025-02777-8 (2026).
- Miller, H. E. et al. Deep learning perturbation models can outperform baselines on calibrated metrics. Nat. Biotechnol. DOI: 10.1038/s41587-026-03307-w (2026).
- Adduri, A. K. et al. Predicting cellular responses to perturbation across diverse contexts with State. Cell 189, 5914– 5931.e20, DOI: 10.1016/j.cell.2026.07.052 (2026).
- Klein, D. et al. CellFlow enables generative single-cell phenotype modeling with flow matching. bioRxiv 2025.04.11.648220, DOI: 10.1101/2025.04.11.648220 (2025).
- Bunne, C. et al. Learning single-cell perturbation responses using neural optimal transport. Nat. Methods 20, 1759–1768, DOI: 10.1038/s41592-023-01969-x (2023).
- Weinreb, C., Wolock, S., Tusi, B. K., Socolovsky, M. & Klein, A. M. Fundamental limits on dynamic inference from single-cell snapshots. Proc. Natl. Acad. Sci. 115, E2467–E2476, DOI: 10.1073/pnas.1714723115 (2018).
- Zhou, J. et al. Deep learning sequence-based ab initio prediction of variant effects on expression and disease risk. Nat. Genet. 50, 1171–1179, DOI: 10.1038/s41588-018-0160-6 (2018).
- Avsec, Ž. et al. Advancing regulatory variant effect prediction with AlphaGenome. Nature 649, 1206–1218, DOI: 10.1038/s41586-025-10014-0 (2026).
- Koo, P. K., Majdandzic, A., Ploenzke, M., Anand, P. & Paul, S. B. Global importance analysis: An interpretability method to quantify importance of genomic features in deep neural networks. PLOS Comput. Biol. 17, e1008925, DOI: 10.1371/journal.pcbi.1008925 (2021).
- Avsec, Ž. et al. Base-resolution models of transcription-factor binding reveal soft motif syntax. Nat. Genet. 53, 354–366, DOI: 10.1038/s41588-021-00782-6 (2021).
- Toneyan, S. & Koo, P. K. Interpreting cis-regulatory interactions from large-scale deep neural networks. Nat. Genet. 56, 2517–2527, DOI: 10.1038/s41588-024-01923-3 (2024).
- Taskiran, I. I. et al. Cell-type-directed design of synthetic enhancers. Nature 626, 212–220, DOI: 10.1038/s41586-023-06936-2 (2024).
- Gosai, S. J. et al. Machine-guided design of cell-type-targeting cis-regulatory elements. Nature 634, 1211–1220, DOI: 10.1038/s41586-024-08070-z (2024).
- Castillo-Hair, S. M. et al. Programming human cell type-specific gene expression via an atlas of AI-designed enhancers. bioRxiv DOI: 10.1101/2025.09.30.679565 (2025).
- de Almeida, B. P., Reiter, F., Pagani, M. & Stark, A. DeepSTARR predicts enhancer activity from DNA sequence and enables the de novo design of synthetic enhancers. Nat. Genet. 54, 613–624, DOI: 10.1038/s41588-022-01048-5 (2022).
- Agarwal, V. et al. Massively parallel characterization of transcriptional regulatory elements. Nature 639, 411–420, DOI: 10.1038/s41586-024-08430-9 (2025).
- Rafi, A. M. et al. A community effort to optimize sequence-based deep learning models of gene regulation. Nat. Biotechnol. 43, 1373–1383, DOI: 10.1038/s41587-024-02414-w (2025).
- Toneyan, S., Tang, Z. & Koo, P. K. Evaluating deep learning for predicting epigenomic profiles. Nat. Mach. Intell. 4, 1088–1100, DOI: 10.1038/s42256-022-00570-9 (2022).
- Pampari, A. et al. ChromBPNet: bias factorized, base-resolution deep learning models of chromatin accessibility reveal cis-regulatory sequence syntax, transcription factor footprints and regulatory variants. bioRxiv 2024.12.25.630221, DOI: 10.1101/2024.12.25.630221 (2026).
- Zhou, J. & Troyanskaya, O. G. Predicting effects of noncoding variants with deep learning-based sequence model. Nat. Methods 12, 931–934, DOI: 10.1038/nmeth.3547 (2015).
- Kelley, D. R., Snoek, J. & Rinn, J. L. Basset: learning the regulatory code of the accessible genome with deep convolutional neural networks. Genome Res. 26, 990–999, DOI: 10.1101/gr.200535.115 (2016).
- Kelley, D. R. et al. Sequential regulatory activity prediction across chromosomes with convolutional neural networks. Genome Res. 28, 739–750, DOI: 10.1101/gr.227819.117 (2018).
- Avsec, Ž. et al. Effective gene expression prediction from sequence by integrating long-range interactions. Nat. Methods 18, 1196–1203, DOI: 10.1038/s41592-021-01252-x (2021).
- Linder, J., Srivastava, D., Yuan, H., Agarwal, V. & Kelley, D. R. Predicting RNA-seq coverage from DNA sequence as a unifying model of gene regulation. Nat. Genet. 57, 949–961, DOI: 10.1038/s41588-024-02053-6 (2025).
- Lal, A. et al. Decoding sequence determinants of gene expression in diverse cellular and disease states. Nat. Methods 23, 1138–1151, DOI: 10.1038/s41592-026-03102-0 (2026).
- Benegas, G., Ye, C., Albors, C., Li, J. C. & Song, Y. S. Genomic language models: opportunities and challenges. Trends Genet. 41, 286–302, DOI: 10.1016/j.tig.2024.11.013 (2025).
- Consens, M. E. et al. Transformers and genome language models. Nat. Mach. Intell. 7, 346–362, DOI: 10.1038/s42256-025-01007-9 (2025).
- Brixi, G. et al. Genome modelling and design across all domains of life with Evo 2. Nature 652, 1349–1361, DOI: 10.1038/s41586-026-10176-5 (2026).
- Benegas, G., Albors, C., Aw, A. J., Ye, C. & Song, Y. S. A DNA language model based on multispecies alignment predicts the effects of genome-wide variants. Nat. Biotechnol. 43, 1960–1965, DOI: 10.1038/s41587-024-02511-w (2025).
- Ye, C. et al. Predicting genome-wide functional constraints with GPN-Star. Nature 659, 141–150, DOI: 10.1038/s41586-026-11005-5 (2026).
- Chao, K.-H. et al. Predicting dynamic expression patterns in budding yeast with a fungal DNA language model. eLife 15, RP112217, DOI: 10.7554/eLife.112217.1 (2026). Reviewed preprint, version 1, 15 September 2026.
- Boshar, S. et al. A multispecies foundation model for genome function prediction, gene annotation and sequence design. bioRxiv 2025.12.22.695963, DOI: 10.64898/2025.12.22.695963 (2025).
- Patel, A. et al. DART-eval: A comprehensive DNA language model evaluation benchmark on regulatory DNA. In Advances in Neural Information Processing Systems, vol. 37, 62024–62061, DOI: 10.52202/079017-1981 (2024). Datasets and Benchmarks Track, 2412.05430.
- Tang, Z., Somia, N., Yu, Y. & Koo, P. K. Evaluating the representational power of pre-trained DNA language models for regulatory genomics. Genome Biol. 26, 203, DOI: 10.1186/s13059-025-03674-8 (2025).
- Sigalova, O. M. et al. Modeling cis-regulatory variation in human brain enhancers across a large Parkinson’s Disease cohort. bioRxiv DOI: 10.64898/2026.03.15.711881 (2026).
- Huang, C. et al. Personal transcriptome variation is poorly explained by current genomic deep learning models. Nat. Genet. 55, 2056–2059, DOI: 10.1038/s41588-023-01574-w (2023).
- Sasse, A. et al. Benchmarking of deep neural networks for predicting personal gene expression from DNA sequence highlights shortcomings. Nat. Genet. 55, 2060–2064, DOI: 10.1038/s41588-023-01524-6 (2023).
- Tu, X., Spiro, A., Chikina, M. & Mostafavi, S. A modality gap in personal-genome prediction by sequence-to-function models. bioRxiv 2026.02.01.702969, DOI: 10.64898/2026.02.01.702969 (2026).
- Yang, J. H. & Hansen, A. S. Enhancer selectivity in space and time: from enhancer-promoter interactions to promoter activation. Nat. Rev. Mol. Cell Biol. 25, 574–591, DOI: 10.1038/s41580-024-00710-6 (2024).
- Cai, X. S. et al. Systematic mapping of enhancers, silencers, and topological elements with prime editing deletion screens. bioRxiv 2026.10.08.756856, DOI: 10.64898/2026.10.08.756856 (2026).
- Karollus, A., Mauermeier, T. & Gagneur, J. Current sequence-based models capture gene expression determinants in promoters but mostly ignore distal enhancers. Genome Biol. 24, 56, DOI: 10.1186/s13059-023-02899-9 (2023).
- Murphy, A. & Koo, P. K. Benchmarking seq2func models on distal enhancer effects with CRISPRi screens. Genomics x AI Blog DOI: 10.5281/zenodo.21383205 (2026).
- Kathail, P. et al. Current genomic deep learning models display decreased performance in cell type-specific accessible regions. Genome Biol. 25, 202, DOI: 10.1186/s13059-024-03335-2 (2024).
- Kempynck, N. et al. CREsted: modeling genomic and synthetic cell-type-specific enhancers across tissues and species. Nat. Methods 23, 946–959, DOI: 10.1038/s41592-026-03057-2 (2026).
- Langfelder, P. & Horvath, S. WGCNA: an R package for weighted correlation network analysis. BMC Bioinforma. 9, 559, DOI: 10.1186/1471-2105-9-559 (2008).
- Huynh-Thu, V. A., Irrthum, A., Wehenkel, L. & Geurts, P. Inferring regulatory networks from expression data using tree-based methods. PLoS ONE 5, e12776, DOI: 10.1371/journal.pone.0012776 (2010).
- Aibar, S. et al. SCENIC: single-cell regulatory network inference and clustering. Nat. Methods 14, 1083–1086, DOI: 10.1038/nmeth.4463 (2017).
- Maizels, R. J. & Briscoe, J. Gene regulatory networks: from correlative models to causal explanations. Nat. Rev. Genet. 27, 485–498, DOI: 10.1038/s41576-026-00939-1 (2026).
- Fleck, J. S. et al. Inferring and perturbing cell fate regulomes in human brain organoids. Nature 621, 365–372, DOI: 10.1038/s41586-022-05279-8 (2023).
- Kamimoto, K. et al. Dissecting cell identity via network inference and in silico gene perturbation. Nature 614, 742–751, DOI: 10.1038/s41586-022-05688-9 (2023).
- Fu, X. et al. A foundation model of transcription across human cell types. Nature 637, 965–973, DOI: 10.1038/s41586-024-08391-z (2025).
- Yazar, S. et al. Single-cell eQTL mapping identifies cell type-specific genetic control of autoimmune disease. Science 376, eabf3041, DOI: 10.1126/science.abf3041 (2022).
- Gayoso, A. et al. AlphaGenome 2 predicts regulatory activity and variant effects across cell states. Technical report, Google DeepMind (2026).
- Alvarez, M. J. et al. Functional characterization of somatic mutations in cancer using network-based inference of protein activity. Nat. Genet. 48, 838–847, DOI: 10.1038/ng.3593 (2016).
- Thielert, M. et al. In the same cell, the proteome defines cellular state and the transcriptome marks transitions. bioRxiv DOI: 10.64898/2026.08.25.746940 (2026). https://www.biorxiv.org/content/early/2026/08/26/2026.08.25.746940.full.pdf.
- Ostuni, R. et al. Latent enhancers activated by stimulation in differentiated cells. Cell 152, 157–171, DOI: 10.1016/j.cell.2012.12.018 (2013).
- Naik, S. & Fuchs, E. Inflammatory memory and tissue adaptation in sickness and in health. Nature 607, 249–255, DOI: 10.1038/s41586-022-04919-3 (2022).
- Lin, J., Li, Z., Zhao, Y., Luo, R. & Pinello, L. EPInformer: scalable and integrative prediction of gene expression from promoter-enhancer sequences with multimodal epigenomic profiles. Nat. Commun. 17, 3975, DOI: 10.1038/s41467-026-70535-8 (2026).
- Nair, S., Kim, D. S., Perricone, J. & Kundaje, A. Integrating regulatory DNA sequence and gene expression to predict genome-wide chromatin accessibility across cellular contexts. Bioinformatics 35, i108–i116, DOI: 10.1093/bioinformatics/btz352 (2019).
- Liu, Q., Hua, K., Zhang, X., Wong, W. H. & Jiang, R. DeepCAGE: incorporating transcription factors in genome-wide prediction of chromatin accessibility. Genomics, Proteomics & Bioinforma. 20, 496–507, DOI: 10.1016/j.gpb.2021.08.015 (2022).
- Jin, J. et al. Decoding the sequence determinants of locus-specific DNA methylation across human tissues. Nat. Commun. 17, 9841, DOI: 10.1038/s41467-026-76744-5 (2026).
- Cazares, T. A. et al. maxATAC: Genome-scale transcription-factor binding prediction from ATAC-seq with deep neural networks. PLOS Comput. Biol. 19, e1010863, DOI: 10.1371/journal.pcbi.1010863 (2023).
- Miao, Y. et al. XChrom: a cross-cell chromatin accessibility prediction model integrating genomic sequence and cellular context. bioRxiv DOI: 10.1101/2025.11.18.689149 (2025).
- Zhang, Z., Feng, F., Qiu, Y. & Liu, J. A generalizable framework to comprehensively predict epigenome, chromatin organization, and transcriptome. Nucleic Acids Res. 51, 5931–5947, DOI: 10.1093/nar/gkad436 (2023).
- Gao, Z., Liu, Q., Zeng, W., Jiang, R. & Wong, W. H. EpiGePT: a pretrained transformer-based language model for context-specific human epigenomics. Genome Biol. 25, 310, DOI: 10.1186/s13059-024-03449-7 (2024).
- Perez, E., Strub, F., de Vries, H., Dumoulin, V. & Courville, A. FiLM: Visual reasoning with a general conditioning layer. In Proceedings of the AAAI Conference on Artificial Intelligence, vol. 32, 3942–3951, DOI: 10.1609/aaai.v32i1.11671 (2018).
- Gao, Z., Sun, Y., Wang, H., Jiang, R. & Liu, Q. RegFM: an interpretable context-aware foundation model for human transcriptional regulation. bioRxiv DOI: 10.64898/2026.08.17.744355 (2026).
- Ha, D., Dai, A. M. & Le, Q. V. Hypernetworks. In International Conference on Learning Representations (2017). 1609.09106.
- Gao, V. R. et al. ChromaFold predicts the 3D contact map from single-cell chromatin accessibility. Nat. Commun. 15, 9432, DOI: 10.1038/s41467-024-53628-0 (2024).
- Peng, Y. et al. EpiXFormer: a cross-attention neural network for predicting cell type-specific transcription factor binding sites. Briefings Bioinforma. 27, bbaf721, DOI: 10.1093/bib/bbaf721 (2026).
- Li, H. & Guan, Y. Fast decoding cell type–specific transcription factor binding landscape at single-nucleotide resolution. Genome Res. 31, 721–731, DOI: 10.1101/gr.269613.120 (2021).
- Li, Y. et al. CREaTor: zero-shot cis-regulatory pattern modeling with attention mechanisms. Genome Biol. 24, 266, DOI: 10.1186/s13059-023-03103-8 (2023).
- Su, X., Yu, H., Zhi, D. & Ji, S. Learning to discover regulatory elements for gene expression prediction. In International Conference on Learning Representations, vol. 2025, 94863–94878 (2025).
- Karbalayghareh, A., Sahin, M. & Leslie, C. S. Chromatin interaction–aware gene regulatory modeling with graph attention networks. Genome Res. 32, 930–944, DOI: 10.1101/gr.275870.121 (2022).
- Grover, A. et al. UniversalEPI: robust prediction of cell type-specific and differential chromatin interactions from DNA sequence and chromatin accessibility. Nucleic Acids Res. 54, gkag485, DOI: 10.1093/nar/gkag485 (2026).
- Li, W., Wong, W. H. & Jiang, R. DeepTACT: predicting 3D chromatin contacts via bootstrapping deep learning. Nucleic Acids Res. 47, e60, DOI: 10.1093/nar/gkz167 (2019).
- Agarwal, A. & Chen, L. DeepPHiC: predicting promoter-centered chromatin interactions using a novel deep learning approach. Bioinformatics 39, btac801, DOI: 10.1093/bioinformatics/btac801 (2023).
- Reddy, A. J., Sudmant, P. H. & Ioannidis, N. M. Sequence models conditioned on splicing factor expression predict splicing in unseen tissues. bioRxiv DOI: 10.64898/2026.01.20.700496 (2026).
- Wu, D. et al. Generative modeling for RNA splicing prediction and design. eLife 14, RP106043, DOI: 10.7554/eLife.106043 (2026).
- Chen, C. et al. DeepGRN: prediction of transcription factor binding site across cell-types using attention-based deep neural networks. BMC Bioinforma. 22, 38, DOI: 10.1186/s12859-020-03952-1 (2021).
- Tan, J. et al. Cell-type-specific prediction of 3D chromatin organization enables high-throughput in silico genetic screening. Nat. Biotechnol. 41, 1140–1150, DOI: 10.1038/s41587-022-01612-8 (2023).
- Nair, S. et al. Nona: A unifying multimodal masking framework for functional genomics. bioRxiv DOI: 10.1101/2025.11.06.687036 (2025).
- Hang, S. et al. Puget predicts gene expression across cell types using sequence and 3D chromatin organization data. bioRxiv DOI: 10.1101/2025.11.19.689320 (2025).
- Tan, J. et al. Decoding the gene regulatory landscape through multimodal learning of protein-DNA interactions. bioRxiv DOI: 10.1101/2025.08.17.670761 (2026). BioRxiv preprint, version 2.
- Wnuk, K. et al. Deep learning implicitly handles tissue specific phenomena to predict tumor DNA accessibility and immune activity. iScience 20, 119–136, DOI: 10.1016/j.isci.2019.09.018 (2019).
- Schreiber, J. M. DragoNNFruit: a method for analyzing scATAC-seq experiments. https://pypi.org/project/dragonnfruit/ (2023). Python package; software, unpublished. Accessed 26 October 2026.
- Liu, H. et al. Predicting cell-state-specific gene regulation from DNA across species. bioRxiv DOI: 10.64898/2026.10.19.760026 (2026). https://www.biorxiv.org/content/early/2026/10/20/2026.10.19.760026.full.pdf.
- Vetsigian, K. et al. Pan-cell-type prediction of splicing patterns from sequence and splicing factor expression. bioRxiv DOI: 10.64898/2026.02.18.706660 (2026).
- Quang, D. & Xie, X. FactorNet: a deep learning framework for predicting cell type specific transcription factor binding from nucleotide-resolution sequential data. Methods 166, 40–47, DOI: 10.1016/j.ymeth.2019.03.020 (2019).
- Murphy, A. E., Beardall, W., Rei, M., Phuycharoen, M. & Skene, N. G. Predicting cell type-specific epigenomic profiles accounting for distal genetic effects. Nat. Commun. 15, 9951, DOI: 10.1038/s41467-024-54441-5 (2024).
- Javed, N. et al. A multi-modal transformer for cell type-agnostic regulatory predictions. Cell Genomics 5, 100762, DOI: 10.1016/j.xgen.2025.100762 (2025).
- Metzner, E., Southard, K. M. & Norman, T. M. Multiome Perturb-seq unlocks scalable discovery of integrated perturbation effects on the transcriptome and epigenome. Cell Syst. 16, 101161, DOI: 10.1016/j.cels.2024.12.002 (2025).
- Shevade, K. et al. Simultaneous capture of single cell RNA-seq, ATAC-seq, and CRISPR perturbation enables multiomic screens to identify gene regulatory relationships. Cell Reports Methods 5, 101222, DOI: 10.1016/j.crmeth.2025.101222 (2025).
- Parker, H. S. & Leek, J. T. The practical effect of batch on genomic prediction. Stat. Appl. Genet. Mol. Biol. 11, Article 10, DOI: 10.1515/1544-6115.1766 (2012).
- Heumos, L. et al. Best practices for single-cell analysis across modalities. Nat. Rev. Genet. 24, 550–572, DOI: 10.1038/s41576-023-00586-w (2023).
- Persad, S. et al. SEACells infers transcriptional and epigenomic cellular states from single-cell genomics data. Nat. Biotechnol. 41, 1746–1757, DOI: 10.1038/s41587-023-01716-9 (2023).
- Crowell, H. L. et al. muscat detects subpopulation-specific state transitions from multi-sample multi-condition single-cell transcriptomics data. Nat. Commun. 11, 6077, DOI: 10.1038/s41467-020-19894-4 (2020).
- Naqvi, S. et al. Transfer learning reveals sequence determinants of the quantitative response to transcription factor dosage. Cell Genomics 5, 100780, DOI: 10.1016/j.xgen.2025.100780 (2025).
- Gertz, J., Siggia, E. D. & Cohen, B. A. Analysis of combinatorial cis-regulation in synthetic and genomic promoters. Nature 457, 215–218, DOI: 10.1038/nature07521 (2009).
- Norman, T. M. et al. Exploring genetic interaction manifolds constructed from rich single-cell phenotypes. Science 365, 786–793, DOI: 10.1126/science.aax4438 (2019).
- Schreiber, J., Singh, R., Bilmes, J. & Noble, W. S. A pitfall for machine learning methods aiming to predict across cell types. Genome Biol. 21, 282, DOI: 10.1186/s13059-020-02177-y (2020).
- Otwinowski, J., McCandlish, D. M. & Plotkin, J. B. Inferring the shape of global epistasis. Proc. Natl. Acad. Sci. 115, E7550–E7558, DOI: 10.1073/pnas.1804015115 (2018).
- Vollenweider, M. & Bühlmann, P. Signal, bounds, and baselines: Principles for evaluating virtual cell perturbation models. bioRxiv DOI: 10.64898/2026.04.20.719650 (2026).
- Zimmerman, K. D., Espeland, M. A. & Langefeld, C. D. A practical solution to pseudoreplication bias in single-cell studies. Nat. Commun. 12, 738, DOI: 10.1038/s41467-021-21038-1 (2021).
- Wei, Z. et al. Benchmarking algorithms for generalizable single-cell perturbation response prediction. Nat. Methods 23, 451–464, DOI: 10.1038/s41592-025-02980-0 (2026).
- Moreno-Torres, J. G., Raeder, T., Alaiz-Rodríguez, R., Chawla, N. V. & Herrera, F. A unifying view on dataset shift in classification. Pattern Recognit. 45, 521–530, DOI: 10.1016/j.patcog.2011.06.019 (2012).
- Lipton, Z., Wang, Y.-X. & Smola, A. Detecting and correcting for label shift with black box predictors. In Proceedings of the 35th International Conference on Machine Learning, vol. 80 of Proceedings of Machine Learning Research, 3122–3130 (PMLR, 2018).
- Ovadia, Y. et al. Can you trust your model’s uncertainty? Evaluating predictive uncertainty under dataset shift. In Advances in Neural Information Processing Systems, vol. 32 (2019).
- Zhou, J., Rizzo, K., Christensen, T., Tang, Z. & Koo, P. K. Uncertainty-aware genomic deep learning with knowledge distillation. npj Artif. Intell. 2, 3, DOI: 10.1038/s44387-025-00053-3 (2026).
- Koo, P. K. & Eddy, S. R. Representation learning of genomic sequence motifs with convolutional neural networks. PLOS Comput. Biol. 15, e1007560 (2019).
- Svensson, V., Gayoso, A., Yosef, N. & Pachter, L. Interpretable factor models of single-cell RNA-seq via variational autoencoders. Bioinformatics 36, 3418–3421 (2020).
- Koo, P. K. & Ploenzke, M. Improving representations of genomic sequence motifs in convolutional networks with exponential activations. Nat. Mach. Intell. 3, 258–266 (2021).
- Ullah, F. & Ben-Hur, A. A self-attention model for inferring cooperativity between regulatory features. Nucleic Acids Res. 49, e77–e77 (2021).
- Novakovsky, G., Fornes, O., Saraswat, M., Mostafavi, S. & Wasserman, W. W. ExplaiNN: interpretable and transparent neural networks for genomics. Genome Biol. 24, 154, DOI: 10.1186/s13059-023-02985-y (2023).
- Balcı, A. T., Ebeid, M. M., Benos, P. V., Kostka, D. & Chikina, M. An intrinsically interpretable neural network architecture for sequence-to-function learning. Bioinformatics 39, i413–i422, DOI: 10.1093/bioinformatics/btad271 (2023).
- Simonyan, K., Vedaldi, A. & Zisserman, A. Deep inside convolutional networks: Visualising image classification models and saliency maps. In 2nd International Conference on Learning Representations (ICLR 2014), Workshop Track Proceedings (2014). 1312.6034.
- Shrikumar, A., Greenside, P. & Kundaje, A. Learning important features through propagating activation differences. In Proceedings of the 34th International Conference on Machine Learning, vol. 70 of Proceedings of Machine Learning Research, 3145–3153 (PMLR, 2017). 1704.02685.
- Chen, H., Lundberg, S. M. & Lee, S.-I. Explaining a series of models by propagating Shapley values. Nat. Commun. 13, 4512, DOI: 10.1038/s41467-022-31384-3 (2022).
- Sundararajan, M., Taly, A. & Yan, Q. Axiomatic attribution for deep networks. In Proceedings of the 34th International Conference on Machine Learning, vol. 70 of Proceedings of Machine Learning Research, 3319–3328 (PMLR, 2017). 1703.01365.
- Gold, M. P. et al. Scoring gene importance by interpreting single-cell foundation models. Nat. Biotechnol. DOI: 10.1038/s41587-026-03112-5 (2026).
- McAnany, C. E. et al. Positional interpretation of cis-regulatory code and nucleosome organization with deep learning models. Nat. Commun. 17, 8326, DOI: 10.1038/s41467-026-74807-1 (2026).
- Shrikumar, A. et al. Technical note on transcription factor motif discovery from importance scores (TF-MoDISco) version 0.5.6.5 (2020). 1811.00416.
- De Winter, S. et al. System-wide extraction of cis-regulatory rules from sequence-to-function models in human neural development. bioRxiv DOI: 10.64898/2026.01.14.699402 (2026).
- Greenside, P., Shimko, T., Fordyce, P. & Kundaje, A. Discovering epistatic feature interactions from neural network models of regulatory DNA sequences. Bioinformatics 34, i629–i637, DOI: 10.1093/bioinformatics/bty575 (2018).
- Seitz, E. E., McCandlish, D. M., Kinney, J. B. & Koo, P. K. Uncovering the mechanistic landscape of regulatory DNA with deep learning. bioRxiv DOI: 10.1101/2025.10.07.681052 (2025).
- Seitz, E. E., McCandlish, D. M., Kinney, J. B. & Koo, P. K. Interpreting cis-regulatory mechanisms from genomic deep neural networks using surrogate models. Nat. Mach. Intell. 6, 701–713, DOI: 10.1038/s42256-024-00851-5 (2024).
- Tareen, A. et al. MAVE-NN: learning genotype-phenotype maps from multiplex assays of variant effect. Genome Biol. 23, 98, DOI: 10.1186/s13059-022-02661-7 (2022).
- Schreiber, J. et al. Programmatic design and editing of cis-regulatory elements. bioRxiv 2025–04 (2025).
- Trabucco, B., Kumar, A., Geng, X. & Levine, S. Conservative objective models for effective offline model-based optimization. In Proceedings of the 38th International Conference on Machine Learning, vol. 139 of Proceedings of Machine Learning Research, 10358–10368 (PMLR, 2021).
- Brookes, D., Park, H. & Listgarten, J. Conditioning by adaptive sampling for robust design. In Proceedings of the 36th International Conference on Machine Learning, vol. 97 of Proceedings of Machine Learning Research, 773–782 (PMLR, 2019).
- Schiebinger, G. et al. Optimal-transport analysis of single-cell gene expression identifies developmental trajectories in reprogramming. Cell 176, 928–943.e22, DOI: 10.1016/j.cell.2019.01.006 (2019).
- Yeo, G. H. T., Saksena, S. D. & Gifford, D. K. Generative modeling of single-cell time series with PRESCIENT enables prediction of cell trajectories with interventions. Nat. Commun. 12, 3222, DOI: 10.1038/s41467-021-23518-w (2021).
- Qiu, X. et al. Mapping transcriptomic vector fields of single cells. Cell 185, 690–711.e45, DOI: 10.1016/j.cell.2021.12.045 (2022).
- Li, C., Virgilio, M. C., Collins, K. L. & Welch, J. D. Multi-omic single-cell velocity models epigenome–transcriptome interactions and improves cell fate prediction. Nat. Biotechnol. 41, 387–398, DOI: 10.1038/s41587-022-01476-y (2023).
- Wang, W. et al. RegVelo: Gene-regulatory-informed dynamics of single cells. Cell 189, 3773–3800.e44, DOI: 10.1016/j.cell.2026.04.022 (2026).
- Karbalayghareh, A. et al. Deep dynamical models of single-cell multiomic velocities predict loss-of-function and rescue perturbations in B cells. Nat. Biotechnol. DOI: 10.1038/s41587-026-03348-1 (2026).
- Rabani, M. et al. High-resolution sequencing and modeling identifies distinct dynamic RNA regulatory strategies. Cell 159, 1698–1710, DOI: 10.1016/j.cell.2014.11.015 (2014).
- Jovanovic, M. et al. Dynamic profiling of the protein life cycle in response to pathogens. Science 347, 1259038, DOI: 10.1126/science.1259038 (2015).
- Lane, K. et al. Measuring signaling and RNA-Seq in the same cell links gene expression to dynamic patterns of NF-κB activation. Cell Syst. 4, 458–469.e5 (2017).
- Wehling, A. et al. Combining single-cell tracking and omics improves blood stem cell fate regulator identification. Blood 140, 1482–1495, DOI: 10.1182/blood.2022016880 (2022).
- Liu, X. et al. Sequential introduction of reprogramming factors reveals a time-sensitive requirement for individual factors and a sequential EMT–MET mechanism for optimal reprogramming. Nat. Cell Biol. 15, 829–838 (2013).
- Stadtfeld, M., Maherali, N., Breault, D. T. & Hochedlinger, K. Defining molecular cornerstones during fibroblast to iPS cell reprogramming in mouse. Cell Stem Cell 2, 230–240 (2008).
- Cohn, D. A., Ghahramani, Z. & Jordan, M. I. Active learning with statistical models. J. Artif. Intell. Res. 4, 129–145, DOI: 10.1613/jair.295 (1996).
- Settles, B. Active learning literature survey. Computer Sciences Technical Report 1648, University of Wisconsin–Madison (2009).
- Friedman, R. Z. et al. Active learning of enhancers and silencers in the developing neural retina. Cell Syst. 16, 101163, DOI: 10.1016/j.cels.2024.12.004 (2025).
- Huang, K. et al. Sequential optimal experimental design of perturbation screens guided by multi-modal priors. In Research in Computational Molecular Biology (RECOMB 2024), vol. 14758 of Lecture Notes in Computer Science, 17–37, DOI: 10.1007/978-1-0716-3989-4_2 (Springer, 2024).
- Mahmood, R., Lucas, J., Alvarez, J. M., Fidler, S. & Law, M. T. Optimizing data collection for machine learning. J. Mach. Learn. Res. 26, 1–52 (2025).
- French, R. M. Catastrophic forgetting in connectionist networks. Trends Cogn. Sci. 3, 128–135, DOI: 10.1016/S1364-6613(99)01294-2 (1999).
- Wang, L., Zhang, X., Su, H. & Zhu, J. A comprehensive survey of continual learning: Theory, method and application. IEEE Trans. Pattern Anal. Mach. Intell. 46, 5362–5383 (2024).
- Romera-Paredes, B. et al. Mathematical discoveries from program search with large language models. Nature 625, 468–475, DOI: 10.1038/s41586-023-06924-6 (2024).
- Novikov, A. et al. AlphaEvolve: A coding agent for scientific and algorithmic discovery. arXiv preprint arXiv:2506.13131 DOI: 10.48550/arXiv.2506.13131 (2025).
- Real, E., Liang, C., So, D. & Le, Q. AutoML-Zero: Evolving machine learning algorithms from scratch. In Proceedings of the 37th International Conference on Machine Learning, vol. 119 of Proceedings of Machine Learning Research, 8007–8019 (PMLR, 2020).
Comments
Add your reaction or comment below.